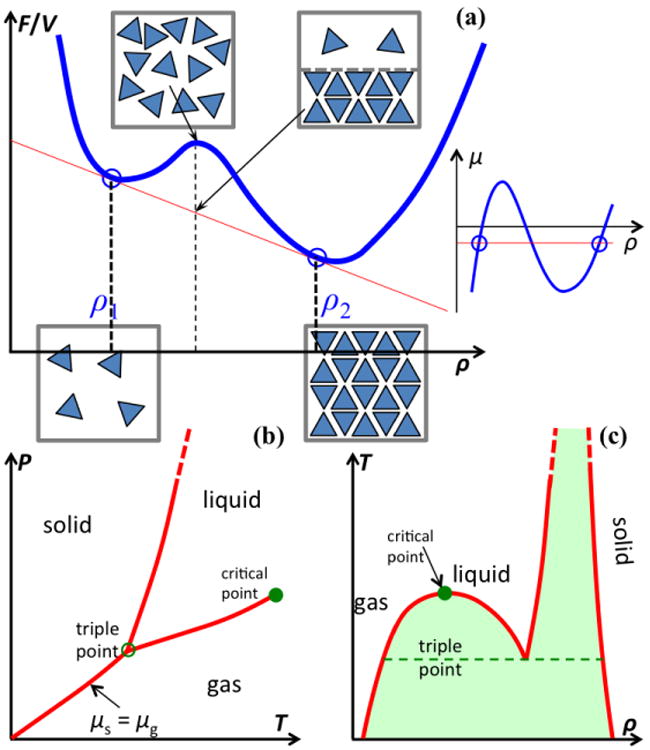
Figure I.

Phase boundaries. (a) Free energy per unit volume, f ≡ F/V, as a function of density, ρ. Two phases emerge when this function (blue curve) is tangent to a single line (in red) at two points (indicated by circles). The two bottom boxes illustrate molecular configurations in two stable phases; the top left box represents a metastable configuration, whereas the top right box represents the separation of two phases. On the far right is an illustration of the Maxwell construction in the μ – ρ plane, where the red line dissects the isotherm (blue curve) with equal areas. (b) Boundaries, on the T – P plane, between three common phases. (c) Coexistence curves on the ρ – T plane. Metastable regions between phases are shaded.
