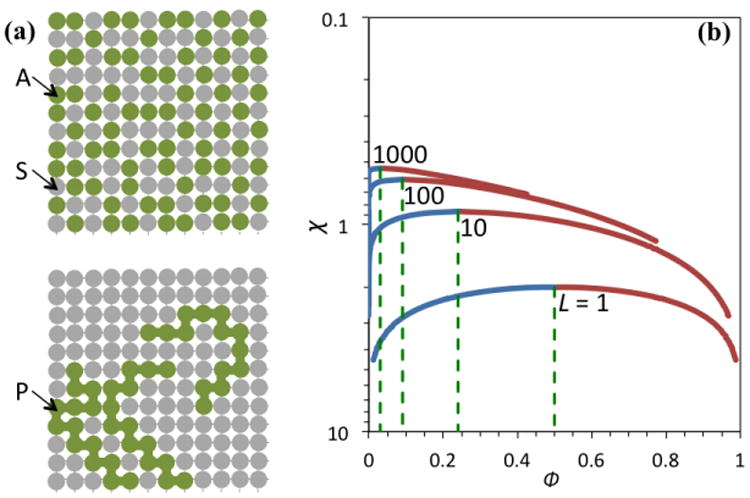
Figure I.

Lattice models and their liquid-liquid phase separation. (a) Lattice models for a mixture of A molecules (top) or polymers (bottom) with S molecules. Each A or S molecule as well as each monomer of the polymers occupies one and only one site on the lattice. (b) Coexistence curves for polymers chains of various lengths. The polymer-poor and polymer-rich branches are in blue and cayenne, respectively. The L = 1 case is equivalent to the A-S mixture.
