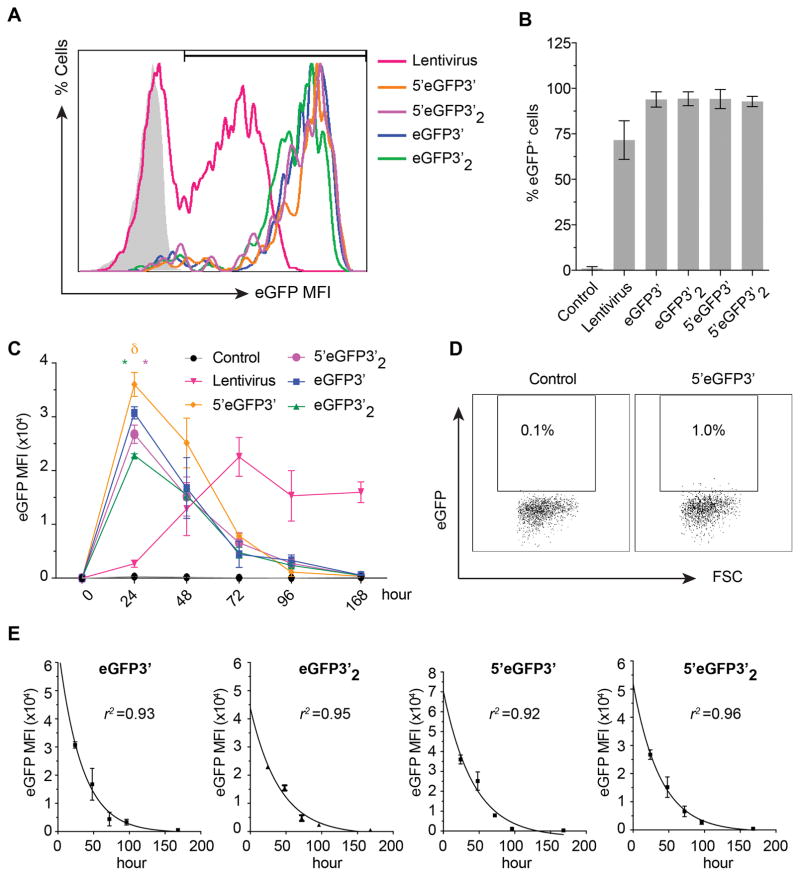
Figure 2. Mean fluorescence intensity, transfection efficiency, and time kinetics of eGFP expression.
A) Flow cytometric histograms show eGFP expression pattern and gating threshold used for subsequent analyses of eGFP. Shaded histogram represents non-transfection control.
B) Percentage of eGFP-positive cells at 24 hours after transfection. Mean±SD from 3 experiments is shown.
C) Time kinetic study of eGFP levels. eGFP mean fluorescence intensity (MFI) from all samples were plotted as 0 at time 0. Green and pink * indicate significant different in eGFP expression compared to their single 3′UTR mimics. δ indicates significance compared to all others. Results are mean ±SD from 3 experiments
D) Representative flow cytometric dot plot showing eGFP expression in WA01 cell line at 1 week after transfection with 5′eGFP3′. E) Non-linear curve fit was performed using the first-order kinetic model (A(t)=A0e−kt). eGFP MFI were plotted on a log scale vs. time. Data represents mean±SD from 3 experiments.

