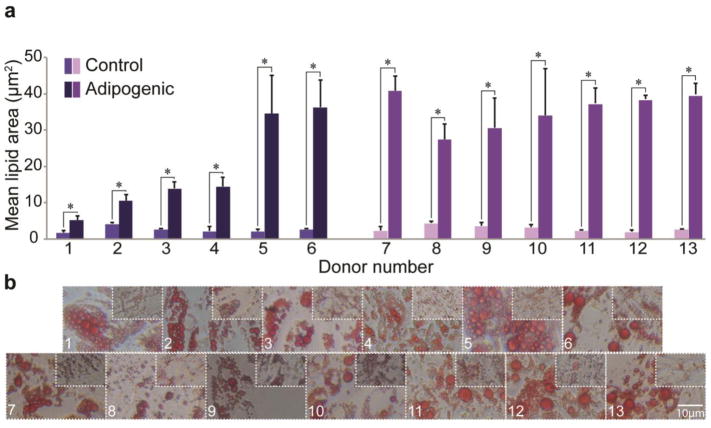
Figure 3. Adipogenic potential of SVF cells by donor.
(A) Mean lipid area for control and adipogenic-induced SVF cell samples for all donors. (B) Representative images of ORO-stained intracellular lipids for adipogenic-induced and control samples. Data shown as mean ± standard deviation, with representative images for each donor. *represents p<0.05. (Donors 1–6: breast cancer remission, Donors 7–13: no cancer diagnosis)

