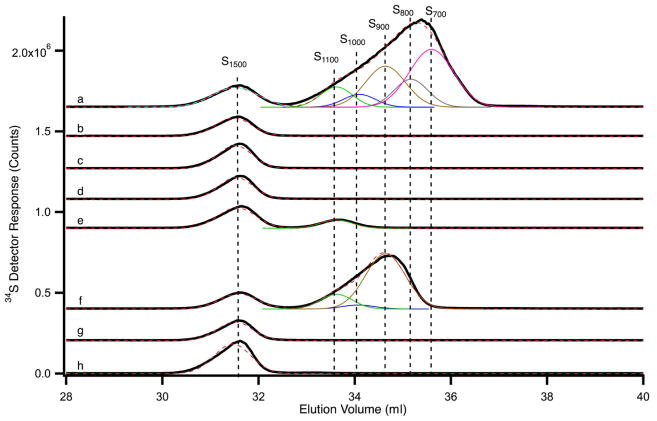
Figure 7. SEC-ICP-MS chromatogram of sulfur species.
Solid black lines are data, and dashed red lines are composite fits. Simulations of individual peaks are color-coded as follows: S1100, green; S1000, blue; S900, brown; S800, grey; S700, pink. a) Exported material from WT mitochondria (cysteine-preloaded); b) exported material from nfs1-14 mitochondria (cysteine-preloaded); c) exported material from WT mitochondria with no cysteine preloading; d) exported material from WT mitochondria (cysteine-preloaded) in which ATPγS rather than ATP was used during the export process; e) exported material from Atm1↓ mitochondria (cysteine-preloaded); f) material isolated from WT mitochondrial matrix after preloading with cysteine; g) material isolated from WT mitochondrial matrix with no cysteine preloading; h) sample buffer only (20 mM Hepes/KOH, pH 7.5). See also Figures 5, S2 and S3, and Table S2.

