
Figure 3.
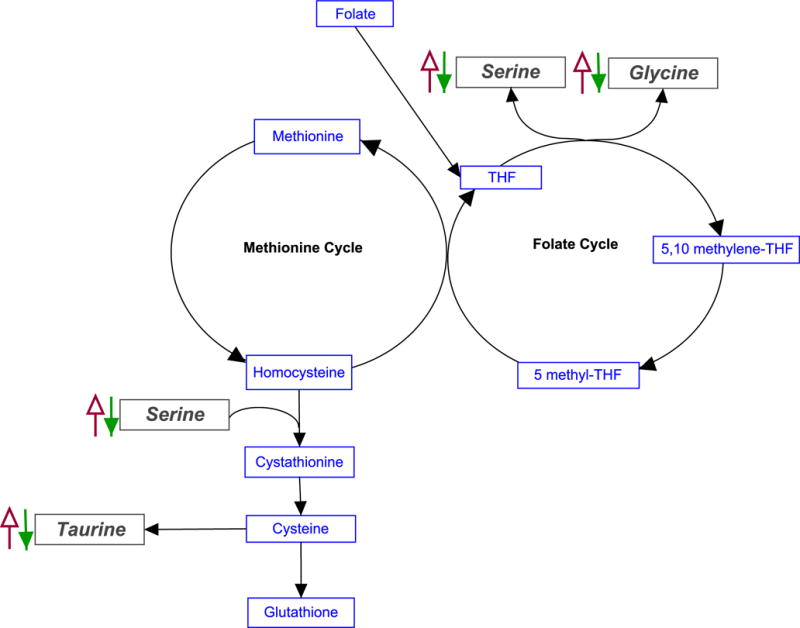
Simplified schematic diagrams of one-carbon metabolism. Arrows depict trend of metabolite concentration with increasing BMI. Solid (green) arrows indicate differentiating metabolites whose concentrations trended inversely with weight among the schizophrenia quartiles. Open (red) arrows indicate differentiating metabolites whose concentrations increased with weight among the BMI controls. The inverse relationship between the concentration of these metabolites with BMI indicates that variability in one-carbon metabolism is not solely due to weight.