
Figure 4.
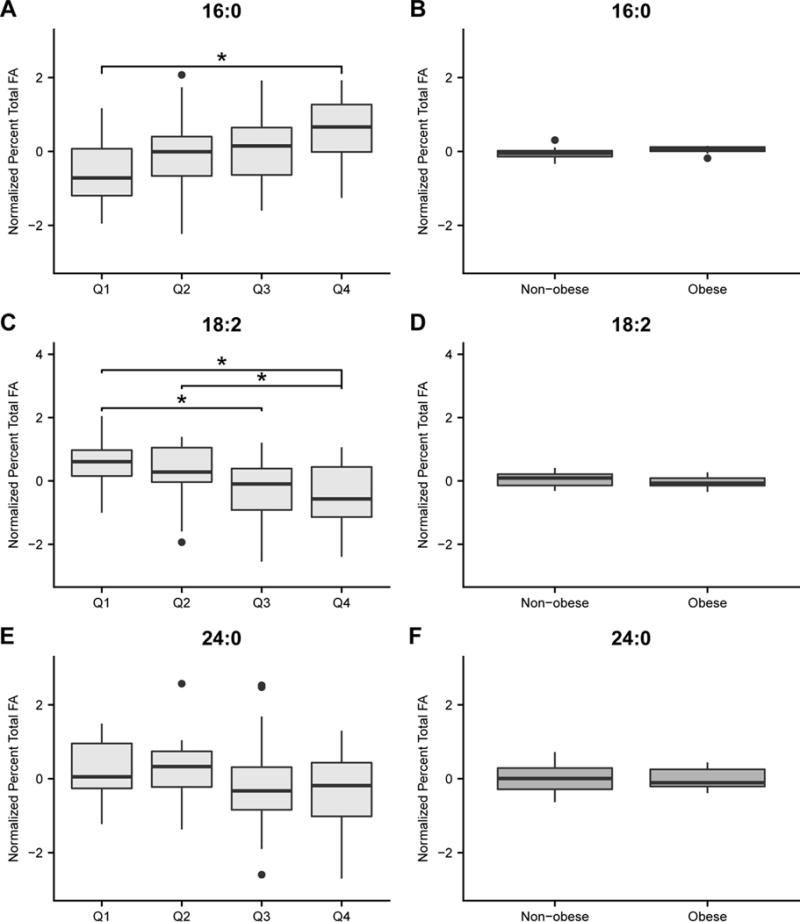
Box and whisker plots of normalized concentrations of individual fatty acids (FA) by percent total that differentiated insulin quartiles in patients wih schizophrenia (ANOVA FDR <25%; A, C, and E) but not BMI (B, D, and F). This was determined if the Student t-test p values comparing the same normalized FA concentrations between the BMI control groups were not significant, or if the FA concentrations were not associated with weight in the BMI schizophrenia groups. Asterisks indicate FA that were significantly different (Tukey Kramer post hoc P<0.05) between quartiles.