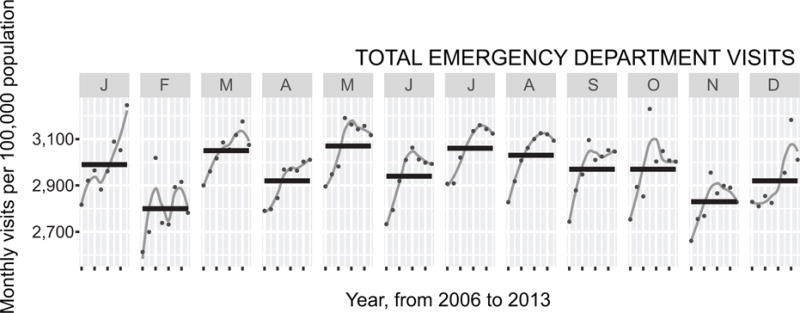
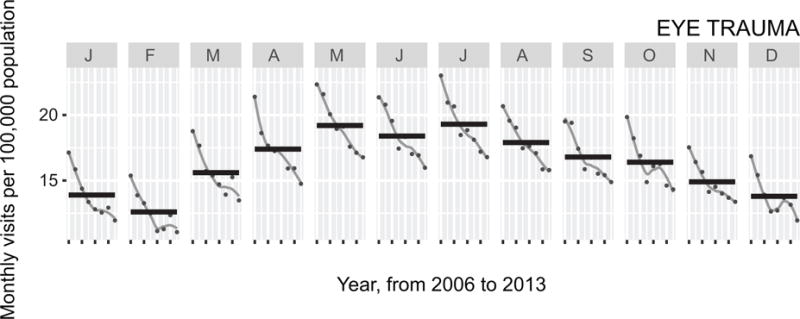
Figure 1. Seasonal variation of eye trauma and overall emergency department visits, 2006-2013.


Each shaded vertical panel displays a calendar month (January to December), with each point representing the monthly incidence due to eye trauma during that month at each of the 8 years of the study period. The grey line is a loess curve depicting trends within a given month over the study period, and the black horizontal line shows the mean number of visits over the study period. The top part of the figure shows eye trauma visits and the bottom part shows total emergency department visits, regardless of diagnosis.
