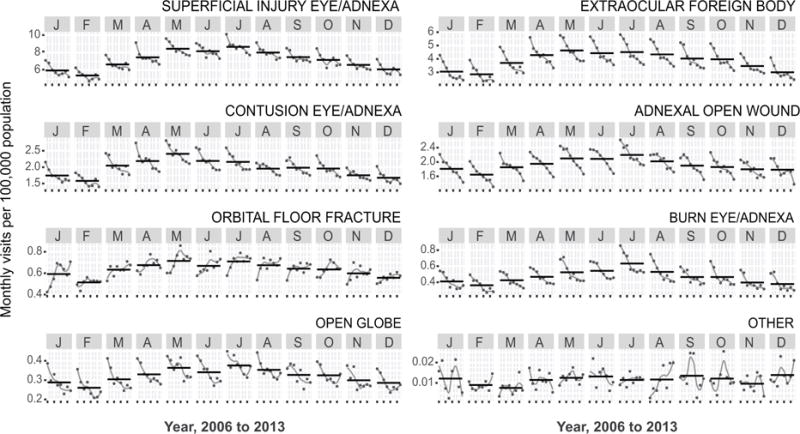
Figure 2. Seasonal variation of eye trauma diagnostic groups, 2006-2013.

Each shaded vertical panel displays a calendar month (January to December), with each point representing the monthly incidence due to eye trauma during that month at each of the 8 years of the study period. The grey line is a loess curve depicting trends within a given month over the study period, and the black horizontal line shows the mean number of visits over the study period. The eight parts of the figure each represent a different diagnostic group, which is labeled at the top right.
