Figure 3.

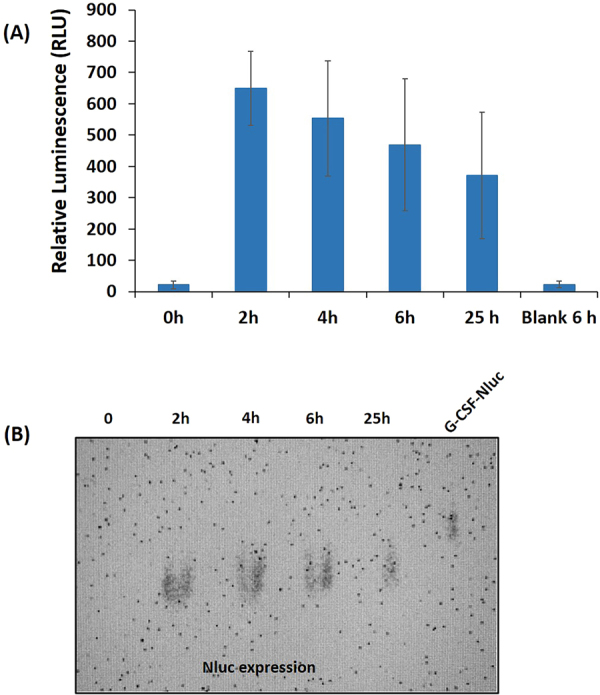
(A) Time-course expression and kinetic analysis of luciferase expression using leukocyte cell-free system. The error bars represent 90% confidence intervals (n = 3). (B) Native-PAGE showing the expression of luciferase and G-CSF-Nluc.

(A) Time-course expression and kinetic analysis of luciferase expression using leukocyte cell-free system. The error bars represent 90% confidence intervals (n = 3). (B) Native-PAGE showing the expression of luciferase and G-CSF-Nluc.