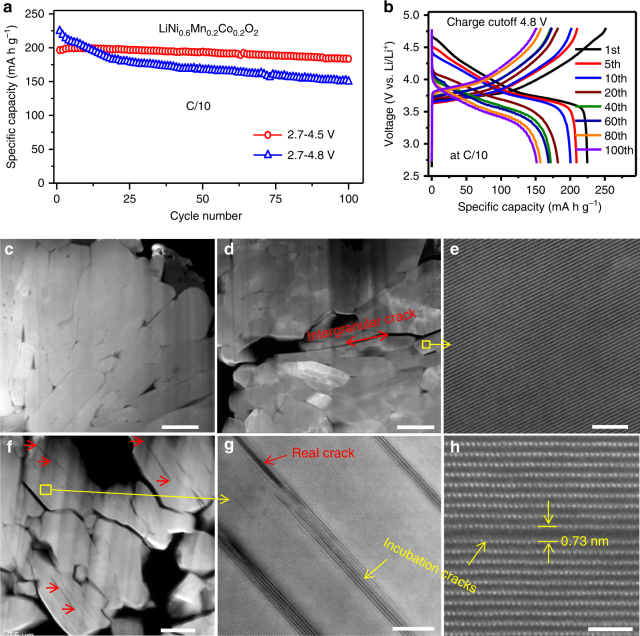
Fig. 1.
Cycling performance and cracks of LiNi0.6Mn0.2Co0.2O2. a Capacity decay and b corresponding charge–discharge voltage profile evolution at cycling window 2.7–4.8 V. Cross-sectional high angle dark field (HAADF) images from (c) pristine sample d, e after 100 cycles at 2.7–4.5 V, f–h after 100 cycles at 2.7–4.8 V. Red arrow in (d) highlights intergranular cracks formed during cycling. Red arrows in (f, g) highlight some intragranular cracks within primary particles. Yellow arrows in (g, h) highlight incubation cracks. The scale bars are 500 nm in (c–f), 10 nm in (g) and 2 nm in (h)

