Fig. 2.
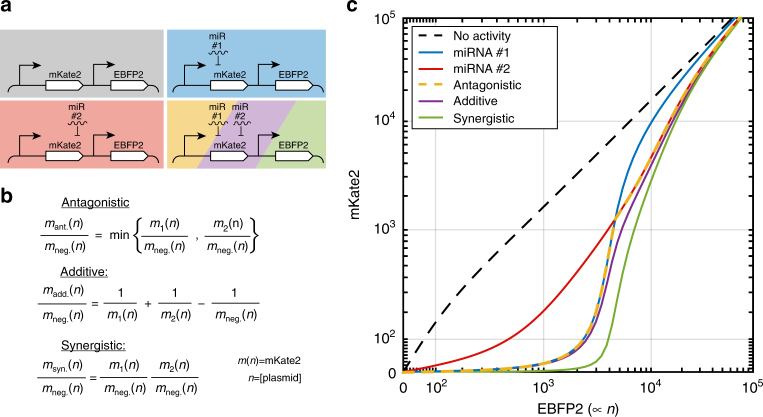
Methods for combining miRNA activities in predictions of 2-input low sensors. a Schematics for 0-input control (gray), 1-input (blue and red), and 2-input miRNA sensors (yellow/purple/green stripe). The 1-input miRNA sensors are first characterized, and the characterization used to predict the behavior of multi-input sensors. b Equations based on the Chou–Talalay method adapted here for predicting miRNA activity of 2-input sensors according to antagonistic, additive, and synergistic interactions. Predictions of free mKate2 mRNA concentration for the three interaction types (mant.(n), madd.(n), and msyn.(n)) are computed based on the characterized output of miRNA 1 (m1(n)) and miRNA 2 (m2(n)). All mKate2 mRNA concentration predictions are functions of the number of plasmids (n) in the cell, which is proportional to EBFP2 fluorescence. mneg.(n) refers to the output of the negative control where no miRNA target sites are present. General equations for cases with more than two miRNA inputs are presented in the Supplementary Note 1. c Calculation of 2-input predictions from single-input activity. Colors for the curves correspond with those from a. The repression curve for the negative control construct without target sites (black) is shown for reference. miRNA repression curves are illustrated for different single miRNAs (blue and red), which are generated by fitting M and Km to sensor data using the single-input model illustrated in Fig. 1. The blue and red single-input repression curves intersect because in this example miRNA #1 exhibits lower M and Km but higher M/Km compared to miRNA #2, leading to greater repression at lower EBFP2 expression levels and vice versa. Antagonistic predictions (yellow) closely follow the miRNA with highest activity (minimal mKate2 expression) for a given level of EBFP2 expression, additive predictions (purple) are similar but with increased overall activity when the two constituent miRNAs have similar individual activity, and synergistic predictions (green) always exhibit higher miRNA activity than either antagonistic or additive predictions. Generally, discrepancy between the two types of predictions varies depending on the number and miRNA activities of the single-inputs, with greater discrepancies when many similar activity single-inputs are combined

