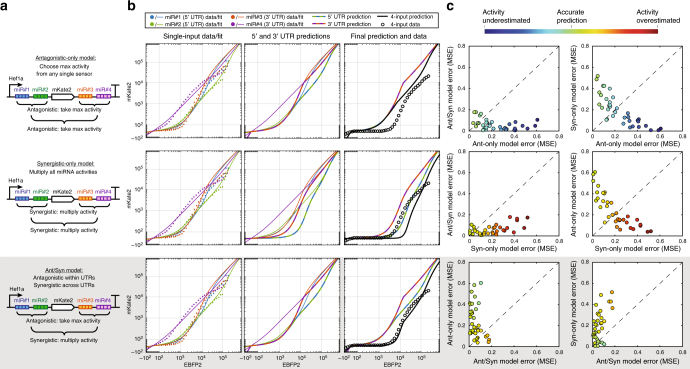
Fig. 5.
Ant/Syn model provides accurate predictions of 4-input miRNA classifiers. a Diagrams for 4-input sensors with associated logic for combining miRNA activity annotated for the antagonistic-only model (top row), synergistic-only model (middle row), and Ant/Syn model (bottom row). Two sets of distinct miRNA target sites were placed in each 5′ and 3′ UTR. b Example 4-input predictions based on single-input data. Rows across panels depict analysis of the sensor configuration in a. Single-input miRNA sensor data and model fits are shown for each of the four miRNAs (left column). Predictions are made separately for the 5′ and 3′ UTRs (center column) by taking the maximum activity for any single sensor (antagonistic-only model and Ant/Syn model) or alternatively by multiplying fold changes (synergistic-only model) in each transfection marker bin. Final predictions are made (right column) by combining activities from 5′ and 3′ UTRs by multiplying fold changes for each UTR (synergistic-only model and Ant/Syn model) or by taking maximum activity (antagonistic-only model). For this example, miR#1 = miR-17-5p, miR#2 = miR-31-3p, miR#3 = miR-519a-3p, and miR#4 = miR-16-5p. All 36 miRNA target combinations tested with associated predictions and data can be found in Supplementary Figs. 12–15. c Comparison of error in antagonistic-only, synergistic-only, and Ant/Syn model predictions for 36 different classifiers. Errors calculated as mean squared error between prediction and obtained data are plotted for each of the three possible comparisons. Additionally, points are colored by the degree of miRNA activity underestimation or overestimation according to the model plotted along the x axis (i.e., top row colored by antagonistic-only model errors, middle row by synergistic-only model error, bottom row by Ant/Syn model errors), resulting in six total graphs. For all 36 tested combinations of miRNAs, errors from the Ant/Syn model were similar or better than those from the other two models, as shown by most points falling within upper-left triangle. In comparison, the antagonistic-only model tended to underestimate repression and the synergistic-only model tended to overestimate repression

