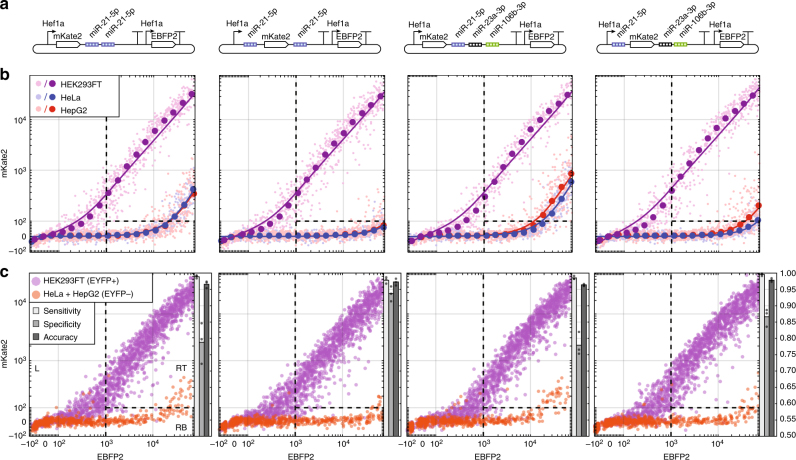
Fig. 6.
miRNA target site position affects cell classifier performance substantially. a Circuit diagrams for miRNA classifiers to distinguish HEK293FT cells from HeLa and HepG2. Two pairs of classifiers were tested, some encoding miRNA targets only in the 3′ UTR and others with one set of miR-21-5p targets moved to the 5′ UTR. miRNAs exhibiting high activity in HeLa and HepG2 cells but not HEK293FT were selected for inclusion. b Fluorescence observed after separate transfections of the corresponding classifiers from a into HEK293FT, HeLa, and HepG2 cells. Expression of mKate2 reporter remained high in HEK293FT cells for all classifiers, but knockdown of mKate2 in HeLa and HepG2 was enhanced only when miR-21-5p targets were placed in the 5′ UTR (columns 2 and 4) compared to the 3′ UTR (columns 1 and 3). Subsampled raw data are indicated as light points and binned data/fits are indicated as dark points/lines. Subsampling was performed to normalize the number of cells within each EBFP2 expression level bin in order to minimize effects of transfection efficiency on sensitivity and specificity measurements. c Classification of three cells lines in co-culture format. HEK293FT cells with genomically integrated constitutive expression of EYFP were co-cultured with HeLa and HepG2. Transfections were performed in cell mixtures for each classifier. After flow cytometry, gating for EYFP+ and EYFP− cells was used to determine whether each cell was HEK293FT or HeLa/HepG2 in origin. Dotted lines demarcate three regions used to determine whether cells were classified as HEK293FT (RT: right top), HeLa/HepG2 (RB: right bottom), or undetermined due to low transfection levels (L: left). Sensitivity or true positive rate is calculated using [RT+]/([RT+] + [RB+]), specificity or true negative rate is calculated using [RB−]/([RB−] + [RT−]), and accuracy is calculated using ([RT+] + [RB−])/([RT+] + [RT−] + [RB+] + [RB−]) where + and − denote EYFP+ and EYFP−, respectively. Classifiers with separate target sites in 5′ and 3′ UTR were better able to distinguish different cell types by reducing off-target expression as indicated by greater specificity (>85%). Bar charts indicate means from three technical triplicates shown as black dots

