
Figure 3.
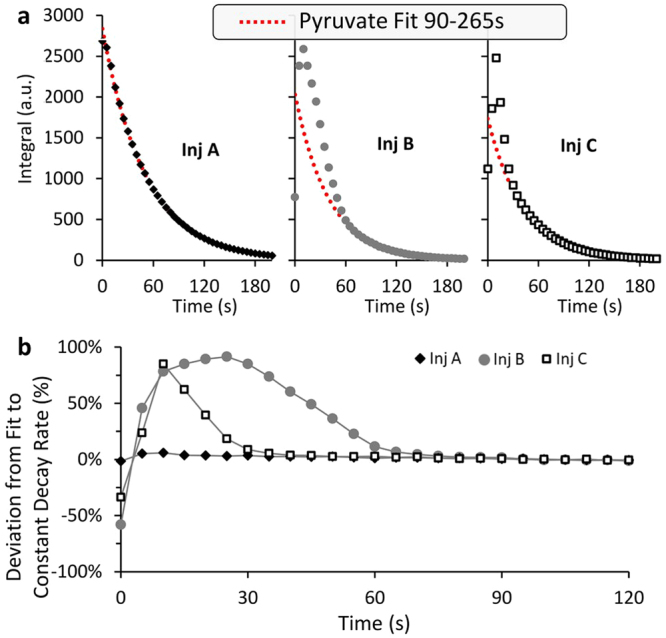
An analysis of the hyperpolarized [1-13C]pyruvate signal decay to determine the extent of brain slices displacement during the hyperpolarized recording. (a) [1-13C]pyruvate signal shown for three injections. Left- An injection demonstrating a near constant decay rate of the [1-13C]pyruvate signal; Middle- An injection in which the time points until ~60 s clearly deviate from the constant decay rate of the [1-13C]pyruvate signal; Right- An injection in which the time points until ~20 s deviate from the constant decay rate of the [1-13C]pyruvate signal. (b) An analysis to determine the percent deviation of the [1-13C]pyruvate signal from the signal expected for a constant decay rate. The constant decay rate of each experiment was determined using the time points of t >90 s. Each data point is presented as its percent deviation from the value expected for this time in the particular experiment.