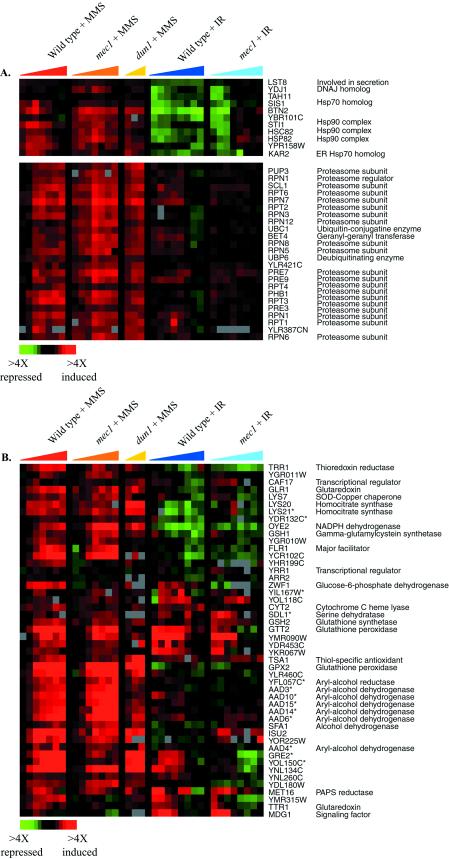
Figure 7.
Genes induced specifically by MMS treatment. The expression pattern of genes encoding protein-folding chaperones and proteasome components (A), and targets of the transcription factor Yap1p (B), after MMS treatment and ionizing radiation (IR) are shown, organized according to the hierarchical cluster analysis of the complete data set. This figure omits a subset of the Yap1p targets that are induced in the ESR by other regulators (Gasch et al., 2000). The time points represented for the DNA damage responses are the same as described in Figure 1, and the color scale that represents the changes in transcript levels is shown in the key at the bottom left of each figure. Adjacent genes on this display that share high sequence similarity and may therefore be subject to cross-hybridization in the microarray analysis are indicated by an asterisk.

