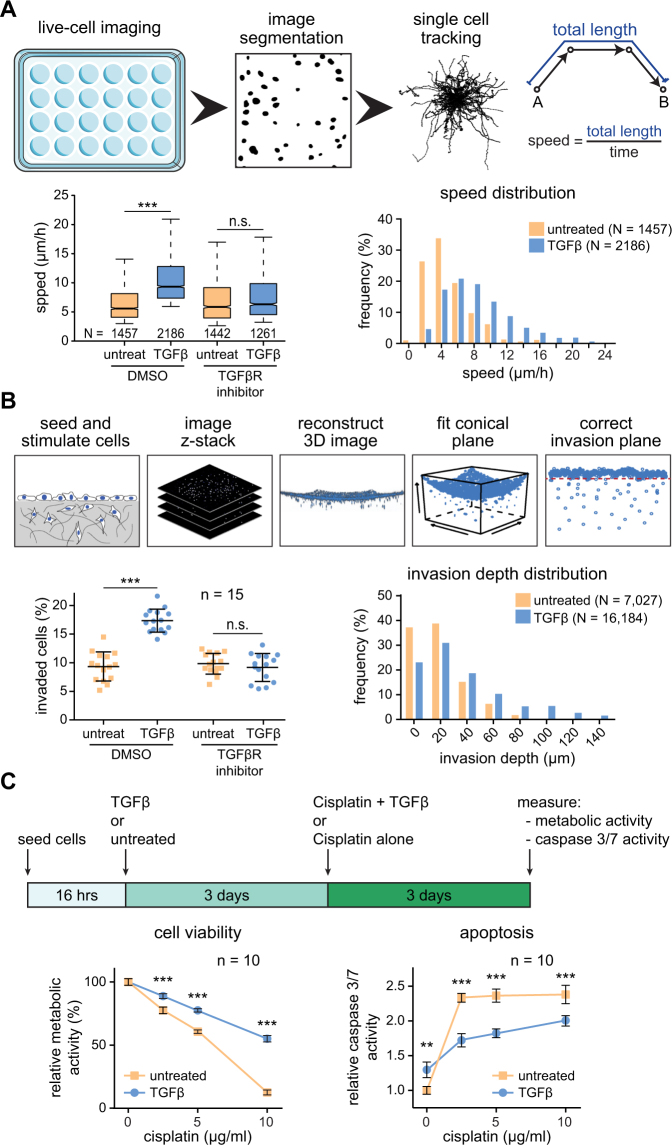
Figure 2.
TGFβ treatment increases invasiveness and cisplatin resistance of squamous lung carcinoma cells SK-MES1. (A) Top, schematics of the 2D migration assay. Bottom, migratory properties of SK-MES1 cells are increased upon TGFβ treatment. Cells were seeded in 24-well plate, pretreated with either SB-431542 or DMSO, stimulated with 2 ng/ml TGFβ1 and imaged for 60 hours. Migration speed from each single cell track was quantified. Center lines show the medians; box limits indicate the 25th and 75th percentiles; whiskers extend to 5th and 95th percentiles, N indicates the number of quantified single cell tracks per condition. Additional independent experiments are shown in Supplementary Fig. S2A. Statistical analysis was performed using one-way ANOVA; ***P < 0.001; n.s., not significant. (B) Top, schematics of the collagen 3D invasion assay. Bottom, TGFβ stimulation increases number of invading cells and the average invasion depth. SK-MES1 cells were seeded in 96-well plates with precast collagen gels, allowed to attach overnight, growth factor-depleted for three hours, pretreated with either SB-431542 or DMSO, stimulated with 2 ng/ml TGFβ1, allowed to invade for four days, stained with Hoechst and imaged with a confocal microscope. The number of invaded cells and invasion depth were assessed. One representative experiment is shown. Data are presented as median and SD, every dot corresponds to a biological replicate (n = 15). N indicates the number of invaded cells. Additional independent experiments are shown in Supplementary Fig. S2B. Statistical analysis was performed using one-way ANOVA; ***P < 0.001; n.s., not significant. (C) Top, schematics of the experimental setup. Bottom, pre-treatment with TGFβ1 reduces sensitivity of SK-MES1 cells to cisplatin treatment. Cells were seeded in 96-well plate, stimulated with either 2 ng/ml TGFβ1 or left untreated for 3 days and then exposed to increasing doses of cisplatin for 3 days. Cell viability and caspase 3/7 activity were assessed. Data presented correspond to mean and SD, n is the number of biological replicates. Additional independent experiments are shown in Supplementary Fig. S1C. Statistical analysis was performed using one-way ANOVA; **P < 0.01; ***P < 0.001.

