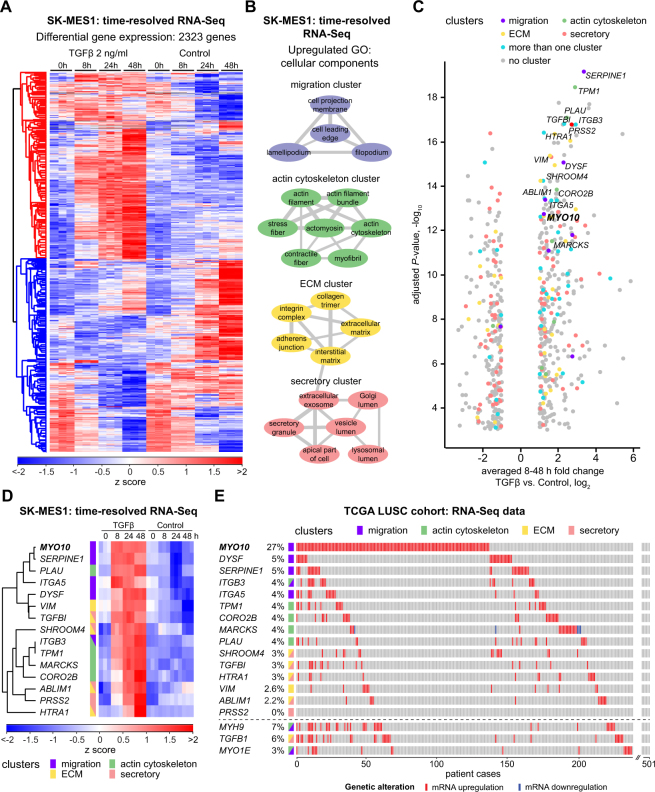
Figure 3.
TGFβ treatment оf LUSC cells results in upregulation of migration- and actin cytoskeleton-related genes. (A) Non-supervised hierarchical clustering of z-scored differentially regulated 2323 genes (adjusted P-value < 0.01) between TGFβ-treated and untreated conditions. SK-MES1 cells were stimulated with 2 ng/ml TGFβ or left untreated. RNA was extracted and sequenced using HiSeq 4000. (B) Clusters of significantly upregulated GO cellular component gene sets between TGFβ-treated and untreated conditions. Significantly upregulated GO terms (adjusted P-value < 0.01) were visualized using REVIGO (allowed similarity 0.5). Thickness of connecting grey lines corresponds to the similarity of the GO terms. Only clusters that consist of at least two GO terms are displayed. (C) Volcano plot of differentially regulated genes between TGFβ-treated and untreated conditions. Fold change of averaged 8–48 h time points between both conditions is displayed. Only significantly regulated genes (adjusted P-value < 0.01) with a fold change of at least two are shown. Five most regulated genes from each cluster of upregulated GO cellular component gene sets are indicated with corresponding colors. Grey circles indicate differentially regulated genes that do not belong to any of the four clusters. (D) Time-resolved dynamics of top differentially regulated candidate genes from each of the clusters. Top five genes from each of the four clusters with the lowest adjusted P-values and fold change of at least two after normalization to untreated samples were selected as candidates. In case the same gene belonged to different clusters and satisfied the inclusion criteria, it was marked as belonging to both clusters. Single gene plots are shown in the Supplementary Fig. S3A. (E) TCGA LUSC cohort RNA-Seq expression data of selected candidate genes sorted by frequency of mRNA upregulation. MYH9, TGFB1 and MYO1E genes were additionally included.

