Figure 1.
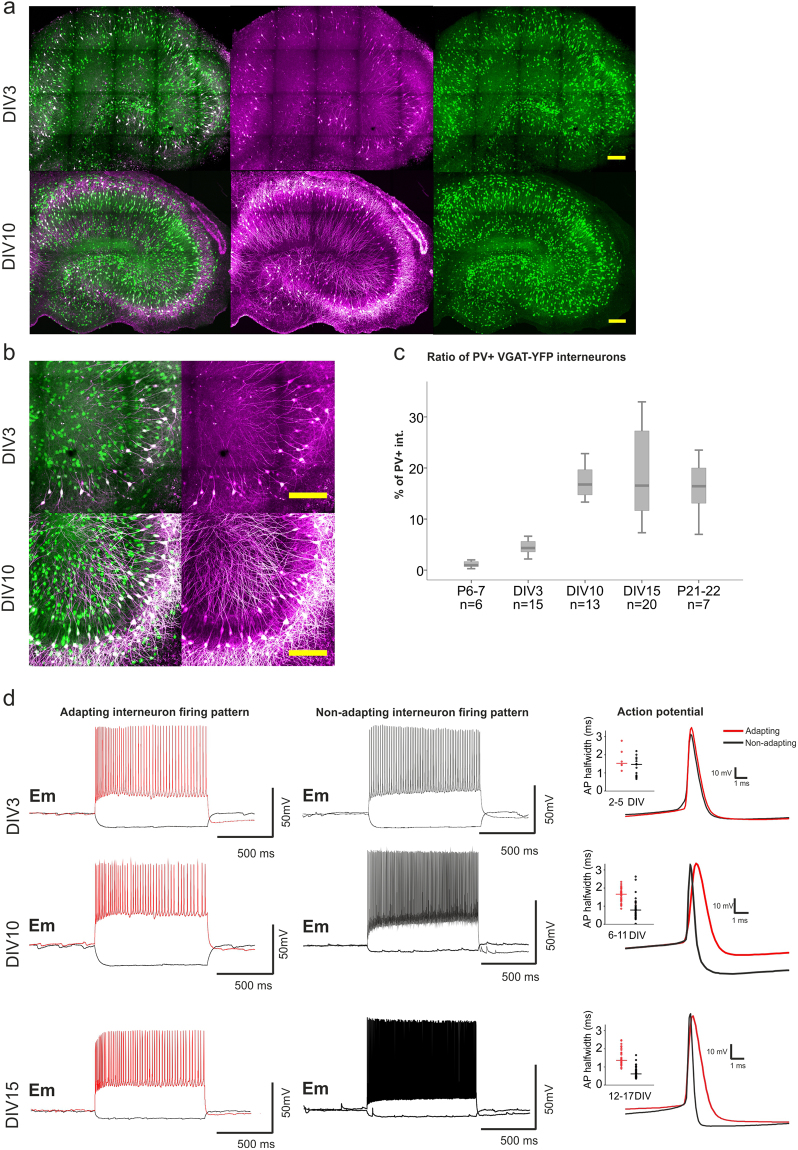
Changes in PV expression and electrophysiological properties of adapting and non-adapting interneurons during slice culture development. Slice cultures of VGAT-YFP rats were labelled for PV at different developmental time points. (a,b) Representative hippocampal images of DIV3 and DIV10 hippocampal slice cultures (a) and respective close ups to the CA3 region are shown (b). VGAT-YFP expressing interneurons are displayed in green and PV+ interneurons in magenta (scale bar 200 µm). (c) Boxplot depicting in percentage the ratio of YFP+/PV expressing interneurons after 3, 10 and 15 DIV (4.31, 16.76 and 16.54%), and in acute slices at postnatal day (P) 7 and 21–22 (corresponding to DIV15) (0.95 and 16.43%). For each in vitro developmental time point hippocampal slices were obtained from 5–6 rats, while for acute slices 3–4 animals were used. The ratio was calculated by counting the total hippocampal number of YFP+ interneurons and PV-labelled interneurons per slice in the 3D reconstruction. (d) Exemplary traces of firing patterns upon a 1 s long depolarization step of adapting (red) and non-adapting (black) interneurons are shown for slice cultures at DIV3, 10 and 15. Representative single action potentials of adapting and non-adapting interneurons taken at different developmental stages (DIV2–5; 6–11, 12–17) (right), the excerpt shows the distribution of action potential width at half maximum of AP amplitude (half-width) for respective cell groups. Cells (164) were recorded from 70 slices obtained from 32 animals (for a detailed description of the in vitro maturation of electrophysiological properties see Supplementary Fig. 1).

