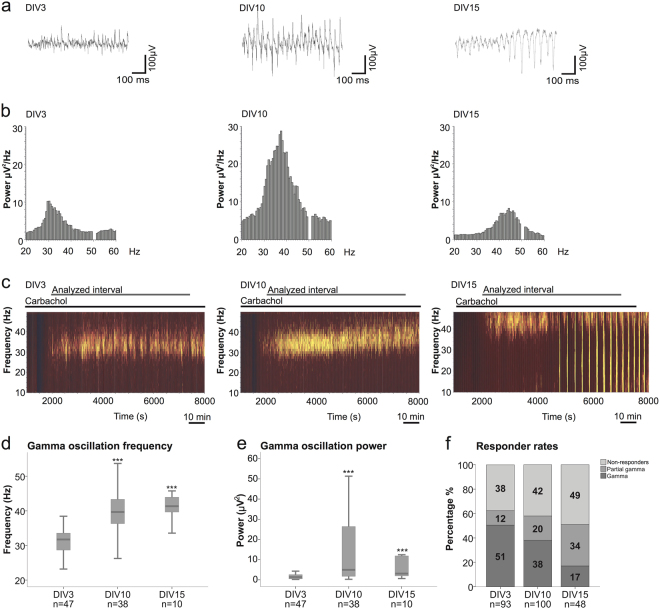
Figure 2.
In vitro maturation of network activity. (a) Exemplary field potential traces of carbachol (Cch) induced gamma oscillations at DIV3 (left), DIV10 (middle) and DIV15 (right). In the DIV15 excerpt, the transition from gamma oscillations to epileptiform discharges are depicted. (b) Representative power spectra (window size: 120 s) of gamma oscillations at DIV3 (left), DIV10 (middle) and DIV15 (right). (c) Representative sonograms of local field potential recordings obtained from DIV3 (left), DIV10 (middle) and DIV15 (right) slices during gamma oscillations. An example of gamma oscillations intermingled with spontaneous discharges observed in DIV15 cultures is shown in the right sonogram. (d,e) Boxplots presenting the gamma oscillation median of peak frequency and power in a 90 min period (from 2000–7400 s recording interval) at DIV3, 10 and 15 (DIV3: 31.7 Hz, 1.3 µV2, DIV10: 39.7 Hz, 4.9 µV2, DIV15: 41.4 Hz, 3 µV2). The number of slices (n) are indicated in the plots. The number of animals used are as follows: 30, 31 and 8 rats for DIV3, 10 and 15, respectively. Kruskal-Wallis test and post-hoc Mann-Whitney U test was used for the comparison between DIV3 and DIV10/15 (***p < 0.001). (f) Responder rates of Cch-induced gamma oscillations are described for the three developmental time points (DIV3, 10 and 15). The number of slices displaying continuous gamma oscillations (gamma), discontinuous gamma oscillations (partial gamma) and non-responder slices (non-responders) are presented in percentage. For statistical analysis the two-tailed Fisher’s exact test was performed.

