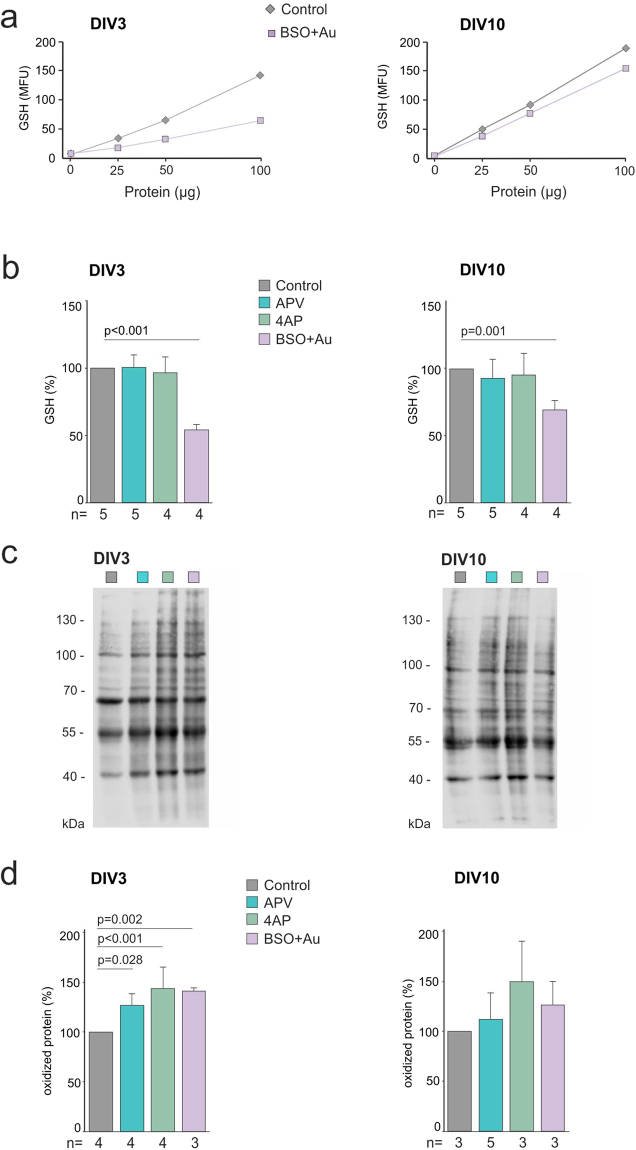
Figure 3.
Effects of NMDAR inhibition, oxidative stress and increased synaptic activity on total GSH content and on protein oxidation levels. (a) Representative examples of the linear correlation between the GSH levels (measured as mBCI fluorescence) and the protein concentration in the cell lysate of DIV3 (left) and 10 (right) in control and BSO/Au treated (oxidative stress) slice cultures. (b) Quantification of the relative GSH content after APV, 4AP and BSO/Au treatments at DIV3 (left) (Control 100; APV 102.8 ± 8.7; 4AP 96.5 ± 12; BSO/Au 55.3 ± 4.3, p = 8.12−8, mean ± SD, ANOVA, post-hoc Bonferroni) and DIV10 (right) (Control 100; APV 93 ± 14.4; 4AP 95.4 ± 16.2; BSO/Au 72.3 ± 8.9, p = 0.001, mean ± SD, ANOVA, post-hoc Bonferroni). All treatments started at DIV1 and the drugs were present throughout the development. The number of independent experiments (n) are shown in the figures, for each experiment (4 or 5) 9–18 slice cultures from 3–4 rats were used. (c) Representative oxyblot (of 3–4 independent experiments) presenting oxidized protein level in cell lysates at DIV3 (left) and 10 (right) in control and treated slice cultures. Full-length gels are included in the supplementary material. (d) Relative oxidized protein levels in control and treated slice cultures at DIV3 (left) (Control 100; APV 126.8 ± 11.5, p = 0.028; 4AP 144.1 ± 19.1, p = 3.5−5; BSO/Au 141.2 ± 4, p = 0.002; mean ± SD, ANOVA, post-hoc Bonferroni) or DIV10 (right) (Control 100; APV 112.1 ± 26.3; 4AP 149.7 ± 40.2; BSO/Au 126.6 ± 23.2, ANOVA, post-hoc Bonferroni). For each experiment (n) 9–18 slice cultures from 3–4 rats were used. Significant differences between groups are marked with the respective p values (Anova test with Bonferroni correction for multiple comparisons).

