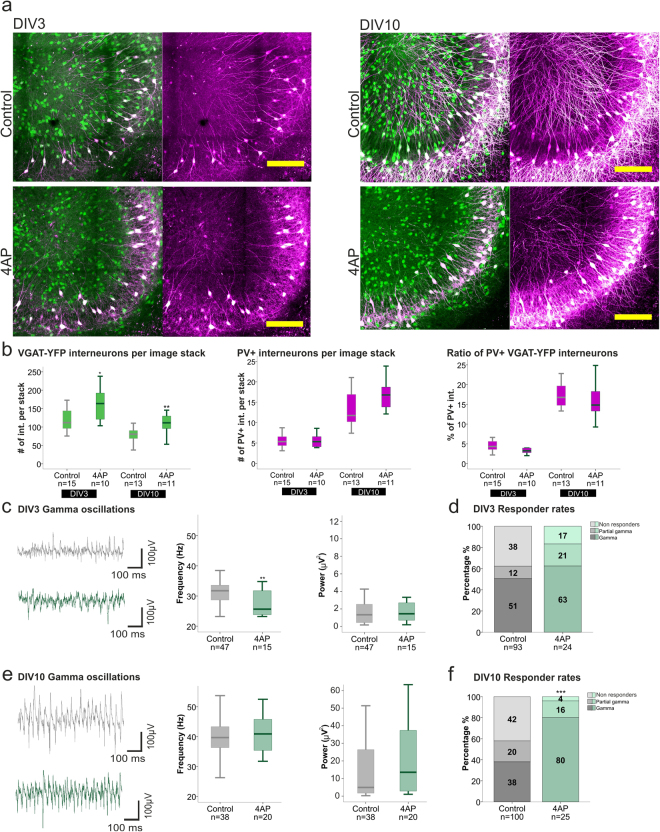
Figure 6.
Effects of increased network activity on PV expression and gamma oscillations. (a) Representative images of the hippocampal CA3 region of control and 4AP treated slices at DIV3 (left) and 10 (right), depicting VGAT-YFP interneurons (green) and PV+ interneurons (magenta) (scale bar 200 µm). (b) Boxplots presenting the median of the number of VGAT-YFP interneurons (left) (DIV3 control 111.8, 4AP 163.8, DIV10 control 80.5, 4AP 111.4) and PV+ interneurons (middle) (DIV3 control 5.4, 4AP 5.3, DIV10 control 11.8, 4AP 16.8) per focal plane as well as the ratio of PV+/YFP+ interneurons in the 3D hippocampal slice (right) (DIV3 control 4.3%, 4AP 3.2%, DIV10 control 16.8%, 4AP 14.8%) for control and 4AP treated slices, at DIV3 and 10. Hippocampal slices were prepared from 5–6 rats per group. The Mann-Whitney U test was used for statistical analysis (*p < 0.05, **p < 0.01). (c,e) Boxplots present the median of the gamma oscillation peak frequency and power of control and 4AP treated slices at DIV3 (c) (control: 31.7 Hz, 1.3 µV2, 4AP: 25.6 Hz, 1.5 µV2) and DIV10 (d) (control: 39.7 Hz, 4.9 µV2; 4AP: 40.9 Hz, 13.5 µV2). The number of animals used for control and 4AP treated slices are as follow: DIV3; 30 and 10 rats, DIV10; 31 and 10 rats. Statistical analysis was performed using the Mann-Whitney U test on the medians of responding slices (**p < 0.01). (d,f) Responder rates to Cch of control and 4AP treated slices recorded at DIV3 (d) and 10 (f) are presented in percentage. Statistical analysis was performed using the two-tailed Fisher’s exact test including the three categories of activity (gamma, partial gamma and non-responders).

