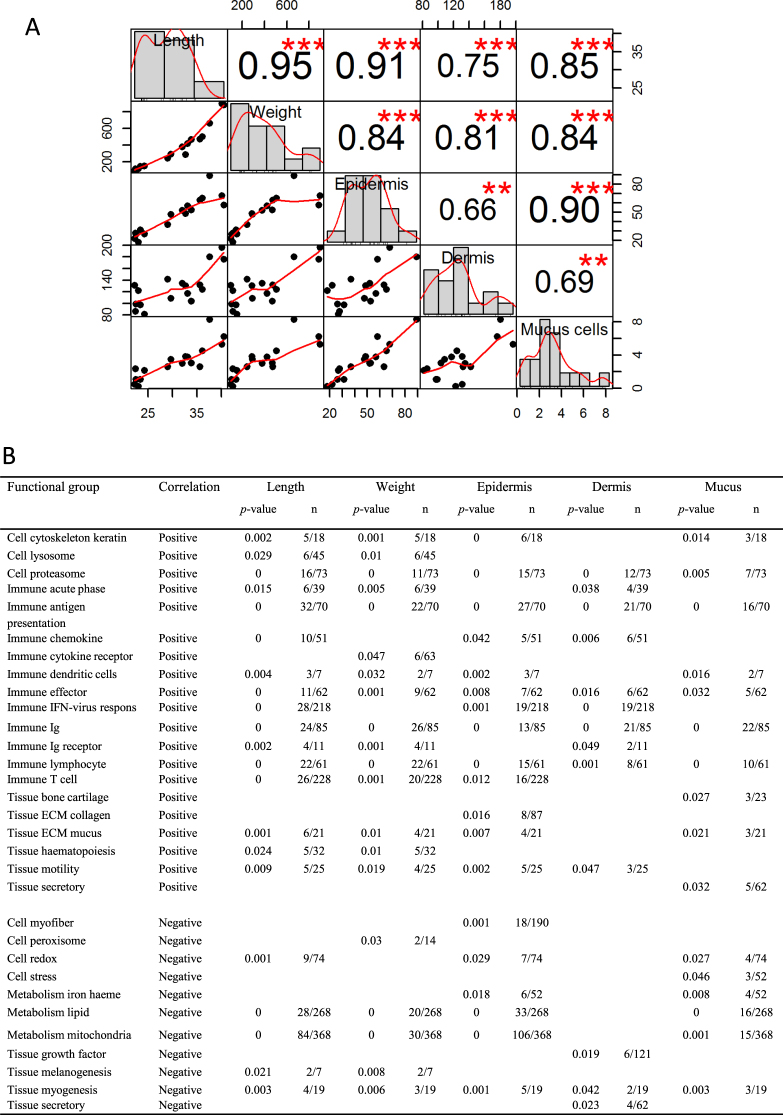
Figure 6.
Correlation between physiological variables and gene transcription patterns. (A) Chart showing patterns of correlations across fish length, fish weight, skin epidermis thickness, skin dermis thickness and number of skin mucus cells. The distribution of each variable is shown on the diagonal. The bottom part of the diagonal shows scatter plots of the physiological measurements with a fitted line displayed. The top part shows the Pearson correlation coefficients for all pairs of variables including significant correlations marked by red stars with p-value: ***<0.001, **<0.01. (B) Results for positively followed by negatively correlated genes to the five variables. Fisher-test p-values are shown (all results for p > 0.05 were removed). Numbers of correlated genes are shown in column “n” together with the total number of genes in the respective category on the array.

