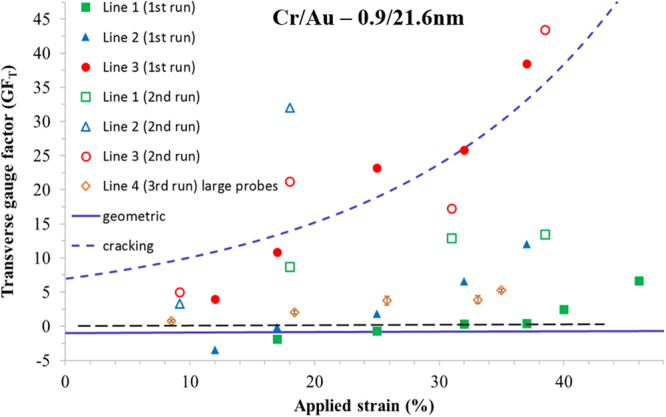
Figure 13.

The transversal gauge factor(GFT) of the lines plotted as a function of applied strain. The filled data points correspond to the first strain sweep on a new sample. The open data points correspond to the second sweep on the same sample. The solid line corresponds to the variation of the gauge factor if purely geometrical effects are taken into account (see Supplementary Figure S13). The long dashed line is the calculated gauge factor based on an average of the experimental data. The short dashed line corresponds to = 0.
