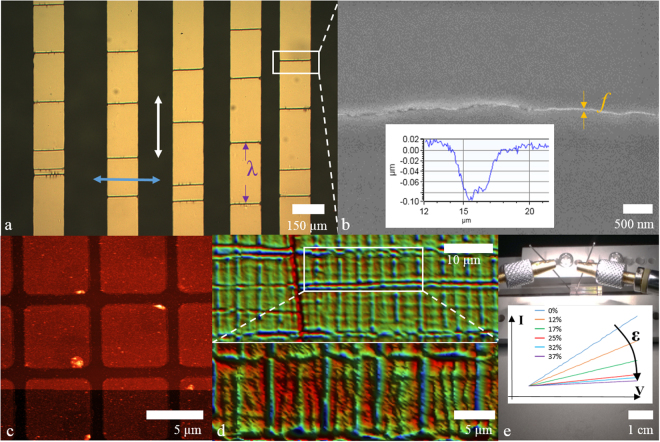
Figure 2.
Measurement techniques used in the study. (a) Optical microscopy. The white and blue arrows indicate the strain directions relative to the long lengths of the wires used in the study. The characteristic crack spacing is indicated by λ. (b) Scanning electron microscopy (SEM)—the crack width f is visible. The inset shows a depth profile of a crack. (c) Atomic force microscopy (AFM) was used to measure the evaporated film thickness and uniformity. (d) Optical interference microscopy was used to produce non-contact, large surface tomography of cracking and buckling. (e) Piezoresistance characterization via current-voltage (IV) measurements using a probe station. The inset shows how the IV changes with applied strain.

