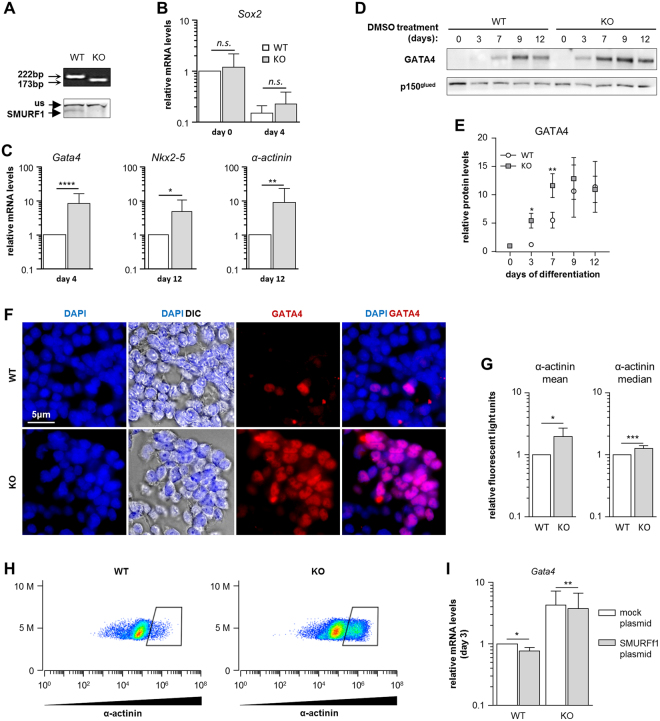
Figure 3.
Functional analysis of SMURF1 during cardiomyogenesis in P19.CL6 cells. (A) Agarose gel (top panel) and WB (bottom panel) of the WT and KO clones used in the experiments. SMURF1 and unspecific (us) band in WB is marked with arrows. (B) qRT-PCR analysis of Sox2 expression on before (day 0) and after DMSO stimulation (day 4) in WT and KO cells. Data are normalized to Gapdh and Psmd4. Ratio paired t-test was used for statistical analysis, n = 10. (C) qRT-PCR analysis of Gata4 expression on day 4 of DMSO stimulation and Nkx2-5 and α-actinin on day 12 of DMSO stimulation. Data are normalized to Gapdh and Psmd4. Ratio paired t-test was used for statistical analyzes *p < 0.05 **p < 0.01****p < 0.0001, n = 10 for Gata4, and n = 8 for Nkx2-5 and α-actinin. (D) WB analysis of GATA4 expression during differentiation in WT and KO cells. p150glued was used as a loading control. The WB showed is representative of three experiments. (E) Quantification of GATA4 protein expression during differentiation. Paired t-test was used for statistical analyses, *p < 0.05, **p < 0.01, n = 3. (F) Immunofluorescence and Differential interference contrast (DIC) microscopy analysis of WT and KO cells on day 3 of DMSO stimulation. GATA4 (red). Nuclei were stained with DAPI (blue). (G) Flow cytometry analysis of α-actinin on day 12 of DMSO stimulation in KO and WT cells. Graphs depict the mean and median of the Relative Fluorescent Light Units with α-actinin antibody. Paired t-test was used for statistical analyses *p < 0.05, ***p < 0.001, n = 6. (H) Density plot of a representative flow cytometry experiment with WT and KO cells. (I) qRT-PCR analysis of Gata4 mRNA expression on day 3 of DMSO stimulation in WT and KO cells treated with either a Mock or Smurf1 expressing plasmid. Data are normalized to Gapdh and Psmd4. A ratio paired t-test was used to for statistical analysis *p < 0.05, **p < 0.01. Original pictures of western blots and the agarose gel are shown in Supplemental Fig. 5.

