Figure 5.
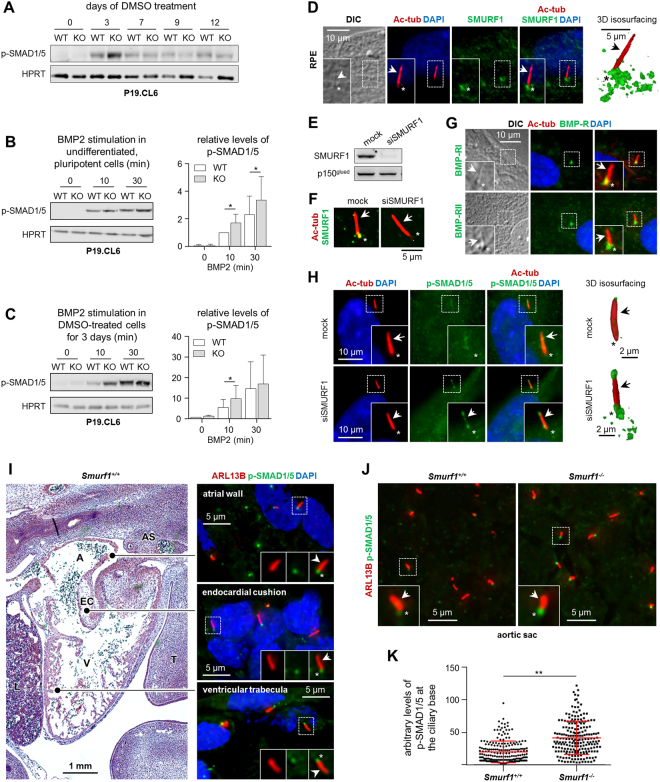
SMURF1 regulates BMP signaling. (A) Representative image of SDS-PAGE and WB analysis of the level of phospho-SMAD1/5 (p-SMAD1/5) during differentiation in WT and KO P19.CL6 cells (n = 3). (B) Left panel: SDS-PAGE and WB analysis of p-SMAD1/5 in P19.CL6 cells differentiated to day three and stimulated with 200 ng/ml BMP2. Right panel: Quantification of the relative levels of p-SMAD1/5 presented in the left panel (n = 5). Paired t-test was used for statistical analyses *p < 0.05. (C) Left panel: SDS-PAGE and WB analysis of p-SMAD1/5 in un-differentiated P19.CL6 cells stimulated with 200 ng/ml BMP2. Right panel: Quantification of the relative levels of p-SMAD1/5 presented in the left panel (n = 3). Paired t-test was used for statistical analyses *p < 0.05. (D) Representative images from IFM analysis with 3D reconstruction and isosurface visualization on the localization of SMURF1 (green) to the primary cilium marked with anti-acetylated α-tubulin (Ac-tub, red, arrows) in RPE cells. Nuclei were stained with DAPI (blue). Asterisks mark the ciliary base area. (E) Representative images from IFM analysis on the localization of BMP receptors I and II (BMP-RI and BMP-RII, respectively) (green) to primary cilia (red) in RPE cells. (F) SDS-PAGE and WB analysis on the efficiency of siRNA-mediated knock-down of SMURF1 (siSMURF1) in RPE cells. (G) IFM analysis confirming that SMURF1 is depleted from cells subjected to siSMURF1 and that antibody recognition of SMURF1 (green) at primary cilium (red) is specific. (H) Representative images from IFM analysis with 3D reconstruction and isosurface visualization of the level of p-SMAD1/5 (green) at the primary cilium (red) in Mock- and siSMURF1-treated RPE cells. p150glued and HPRT were used as loading controls. Original pictures of western blots are shown in Supplemental Fig. 5. (I) Representative images from IFM analysis of WT mouse embryonic hearts at E12.5. Phosphorylation of SMAD1/5 (p-SMAD1/5, green) at the base of the primary cilium (ARL13B, red) was observed in the atrial wall, ventricular trabeculae and endocardial cushions (EC). (J) Representative images of the level of p-SMAD1/5 (green) at the base of the primary cilium (red) in cells surrounding the region of the pharyngeal arch arteries in WT and Smurf1−/− embryos. (K) Quantification of the arbitrary levels of p-SMAD1/5 at the ciliary base (n = 3). Paired t-test was used for statistical analyses **p < 0.01.

