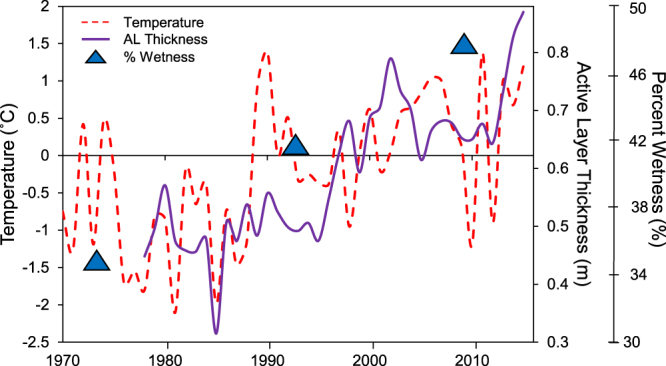
Figure 1.

Decadal trends show increasing annual means for the Abisko area including annual air temperature (updated from Callaghan et al.31), autumnal active layer thickness (from 1978, updated from Akerman & Johansson17; bars represent standard deviations) and wetness data from Stordalen (based on three values from 1970, 1990 and 2008, updated from Malmer et al.18). Temperature data were collected at the Abisko Scientific Research Station, 10 km from Stordalen. Active layer thickness were measured in multiple mires in the Abisko area. The data on percent wetness from 2008 and ALT from 2007 is a contribution from this study.
