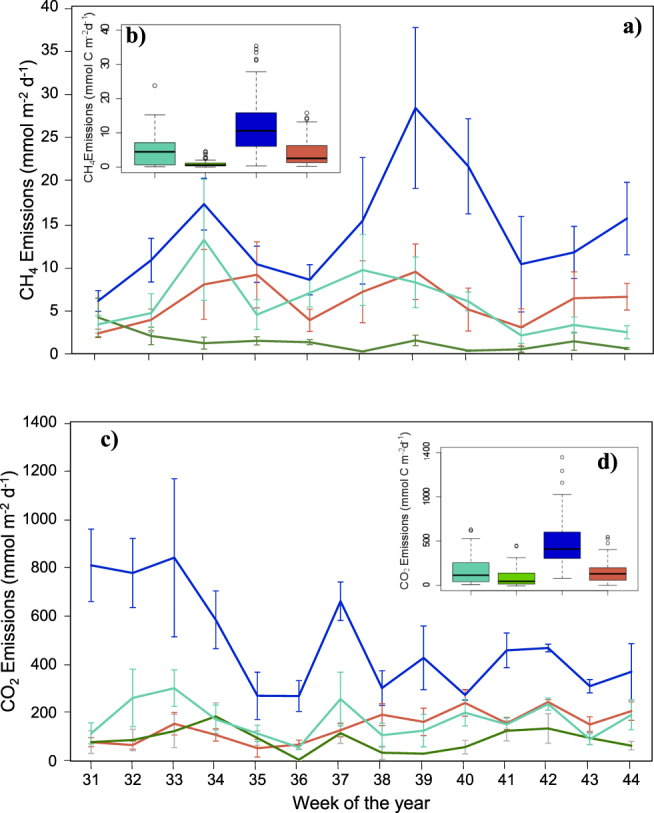
Figure 2.

(a) Temporal, bi-weekly diffusive CH4 emissions for lake-fed (light green), moss-dominated (dark green), open-water (blue) and sedge-dominated (orange) ponds. (b) Mean CH4 emissions over the sampling period for each pond type. (c) Temporal, bi-weekly CO2 emissions. (d) Mean CO2 emissions over the sampling period for each pond type. Note the difference in scales. Error bars on bi-weekly plots represent the variation between mean fluxes from individual ponds within each pond type. Mean open-water pond emissions were the highest for both CO2 and CH4 compared to the rest of the pond types (Mann-Whitney U Statistical test, p-value < 0.001 for open-water and other pond type pairs).
