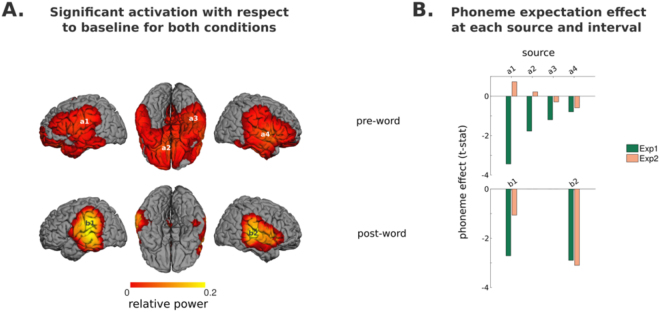
Figure 3.
Source reconstruction of ERF effects. (A) Regions of significant power change with respect to baseline (both conditions and experiments, N = 41) at 250 ms windows just before and after word onset. The peak activity locations within these areas are marked (a1 to b2) within these images. (B) Effect-size of the phoneme-expectation effect (estimated as the standardized difference between conditions) at each peak and time interval for each experiment separately (N = 20, 21).

