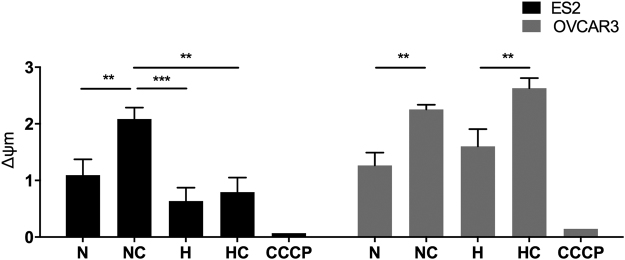
Figure 3.
Mitochondrial membrane potential under normoxia and hypoxia with and without cysteine, in ES2 (OCCC) and OVCAR3 (OSC) cells. Quantification of Δψm expressed as a ratio of red/green fluorescence intensity ratio in the different treatments (ratio of geometrical means) for ES2 and OVCAR3 cell lines for 16 h of assay. CCCP is a positive control for depolarization. N – Normoxia; NC – Normoxia supplemented with cysteine; H – Hypoxia; HC – Hypoxia supplemented with cysteine. Results are shown as mean ± SD. *p < 0.05, **p < 0.01, ***p < 0.001 (One-way ANOVA with post hoc Tukey tests).

