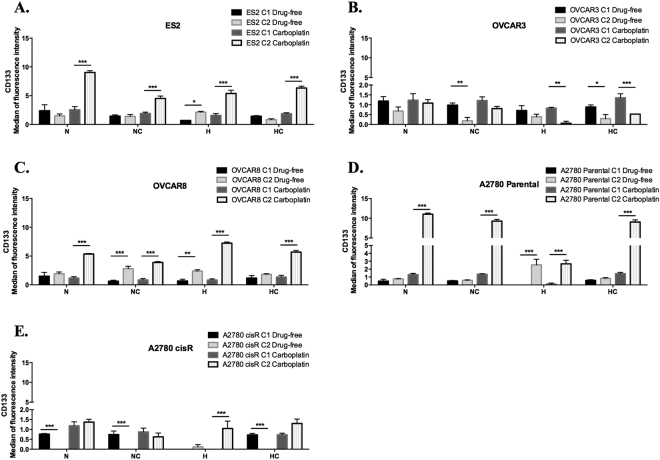
Figure 6.
In ES2, OVCAR8 and A2780 cancer stem CD133+ cells command resistance to hypoxia and carboplatin. CD133 expression levels in a drug-free environment and upon carboplatin exposure for (A) ES2 cells, (B) OVCAR3 cells, (C) OVCAR8 cells, (D) A2780 parental cells and (E) A2780 cisR cells in the first and in the second cycles of treatments. N – Normoxia; NC – Normoxia supplemented with cysteine; H – Hypoxia; HC – Hypoxia supplemented with cysteine. Results are shown as mean ± SD. Asterisks represent statistical significance among the first and the second cycle within the same treatment. *p < 0.05, **p < 0.01, ***p < 0.001 (One-way ANOVA with post hoc Tukey tests).

