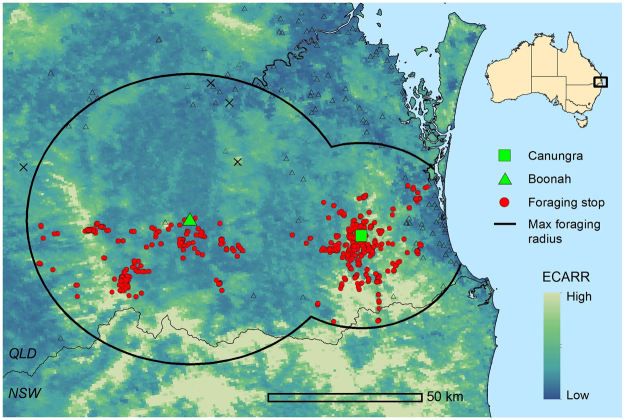
Figure 1.
Study area of analysis, defined by the maximum observed foraging radius (46 km for Boonah and 30 km for Canungra), is plotted with unfiltered foraging areas (red points). Location of the roosts at Boonah and Canungra are shown as a green triangle and square respectively. The four black exes indicate foraging areas that were deemed outliers based on their proximity to different roosting sites. The black line represents the maximum foraging radius for Pteropus poliocephalus and the black triangles show locations of additional roosting sites. The background shows the distribution of the Eucalypt Chlorophyll a Reflectance Ratio (ECARR) which indicates areas with dense vegetation as light yellow and areas of less-dense vegetation as light blue. This map was generated using ESRI ArcGIS Desktop: Release 10 (www.esri.com).

