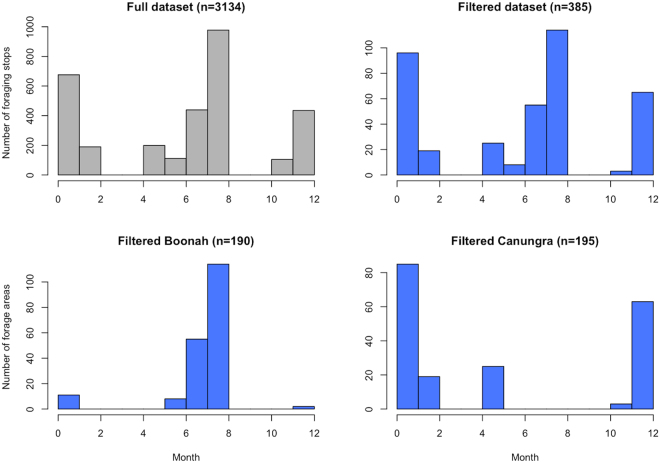
Figure 12.
Histograms plotting the number of foraging stops of Pteropus poliocephalus recorded at roosts in Boonah and Canungra in southeastern Queensland. The month is plotted on the y-axis and the x-axis shows the number of individual foraging stops in the top panel, and the number of aggregated foraging areas in the bottom panel. The full unfiltered data set is shown in grey at the top left. The filtered data (clustered foraging stops, urban points removed, aggregated to resolution of environmental data) is shown in blue. Data were not retrieved from individual bats in Mar/Apr and Sep/Oct (see top right). Foraging activity tends to occur in the winter around the Boonah roost, and in the summer around the Canungra roost. For a detailed description of the movement data, see Westcott et al.4.

