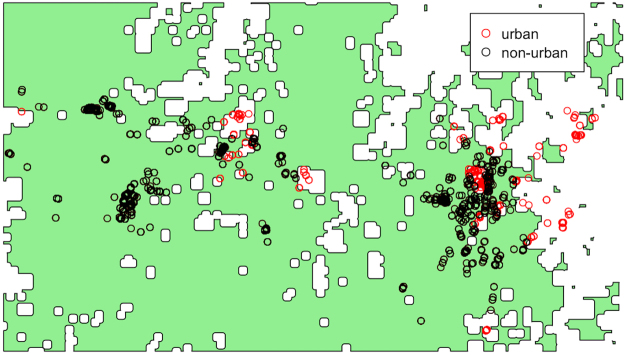
Figure 13.
The spatial distribution of Pteropus poliocephalus foraging areas (aggregated foraging stops; see Methods) plotted around their home roosts in Boonah and Canungra in southeastern Queensland. The area shaded green represents non-urban areas and the white areas represent urban and peri-urban areas. Observed foraging areas that are found within non-urban areas are plotted as black circles and the red circles indicate those in urban and peri-urban areas.

