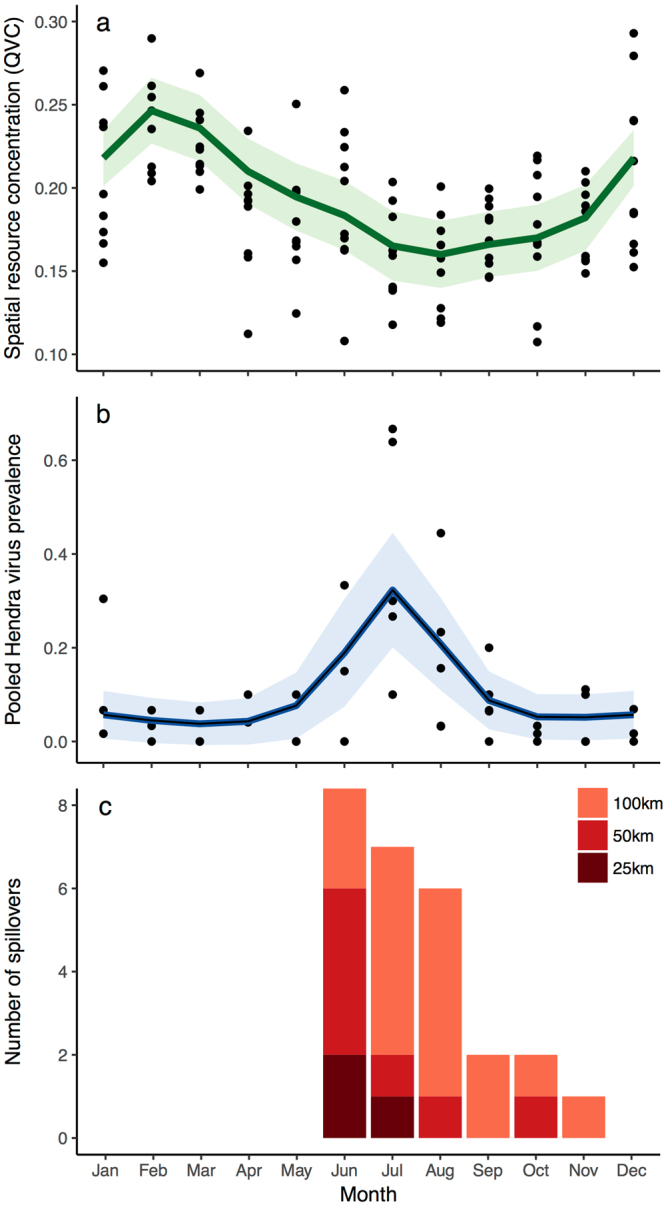
Figure 8.

Seasonal trends in (a) spatial resource concentration as quantified by the quartile variation coefficient (QVC) within 50 km of both Boonah and Canungra roosts, (b) Hendra virus prevalence at the Boonah roost from July 2011–June 2014 (prevalence calculated from pooled under-roost urine samples26), and (c) the total number of spillover events within 25, 50, and 100 km of the both Boonah and Canungra roosts. Lines in (a) and (b) represent fitted Generalized Additive Models with cubic cyclic spline smoothing terms and their 95% confidence intervals.
