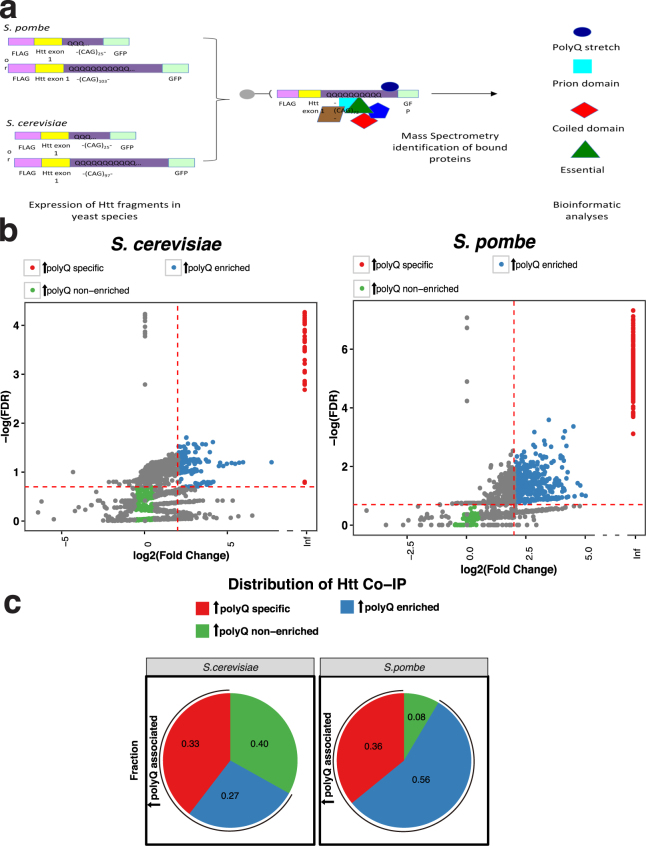
Figure 2.
(a) Experimental design of proteomic analysis of Htt Co-IP proteins from S. cerevisiae and S. pombe. Inducible Htt exon 1 flanked by an N-terminal FLAG tag and a repeat stretch of 25Q or 103Q in S. pombe (top) or 25Q or 97Q in S. cerevisiae (bottom), and by a C-terminal GFP tag, was genomically integrated. Following induced expression, cultures were grown to mid-log phase and prepared for co-IP using magnetic beads with a conjugated anti-FLAG antibody. The Htt-bound specific proteins were identified and their abundance determined using a quantitative mass spectrometry approach; the data was then subjected to statistical analysis and classification. (b) Volcano plot of expanded co-IP proteins from S. cerevisiae and S. pombe. The volcano plots show the relation between the FDR and the fold change of expanded (designated by ↑) polyQ specific, enriched, and non-enriched groups in S. cerevisiae (left) and S. pombe (right). The Y-axis indicates the negative log10-transformed FDR of proteins in each group, and the X-axis shows log2-transformed fold change of proteins in each group. The dashed line intersecting the X-axis shows the fold change threshold to define each group and the dashed line intersecting the Y-axis shows the FDR threshold to define each group. (c) Protein classification of the expanded Htt co-IP proteins. Percentages of each group (expanded polyQ specific, expanded polyQ enriched, and expanded polyQ non-enriched) in the co-IP proteins from S. cerevisiae (left) and S. pombe (right).

