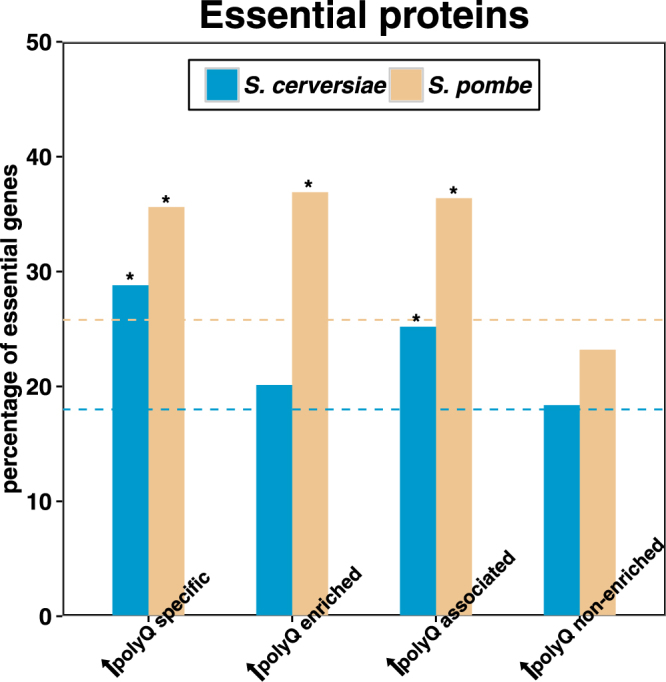
Figure 3.

Essentiality analysis of expanded Htt co-IP proteins specific proteins. The bar-plot shows the percentage of essential genes of each group in S. cerevisiae (blue) and S. pombe (yellow). The Y-axis indicates the percentage of essential genes, and the X-axis shows the name of each group. Dashed lines show the background percentage of essential genes in the genome of S. cerevisiae (blue) and S. pombe (yellow). Asterisk shows the statistical significance in each group (*P < 0.05, **P < 0.01), calculated by the Fisher’s exact test. Detailed values and statistical results are provided in Supplementary Table 2.
