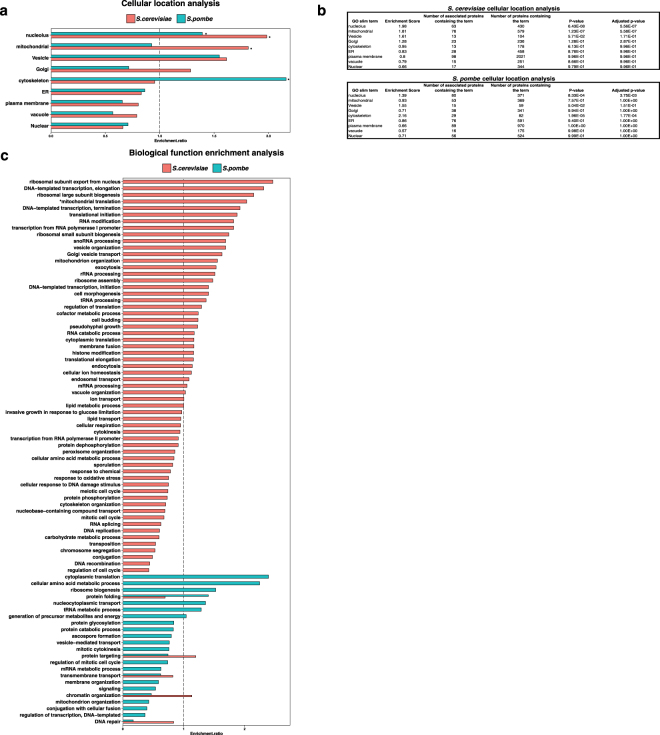
Figure 4.
GO analysis of expanded co-IP proteins from S. cerevisiae and S. pombe. (a) Cellular compartment GO-derived terms (see Methods) were used to classify the cellular localization of expanded polyQ-associated group co-IP identifications; S. cerevisiae (red) and S. pombe (teal). Htt-97Q and Htt-103Q expanded polyQ-associated group co-IP identifications. The statistical significance indicated by *P < 0.05, calculated by Fisher’s exact test. (b) Cellular compartmentalization analysis of GO-derived terms used to classify the cellular localization of S. cerevisiae (top) and S. pombe (bottom). Statistical significance is relative to the expanded polyQ non-enriched group for each species. (c) GO Slim biological process enrichment analysis of Htt-97Q and Htt-103Q expanded polyQ-associated group co-IP identifications in S. cerevisiae (red) and S. pombe (teal). GO Slim terms related to biological function that overlapped between the two species were chosen for the analysis. The Y-axis shows the gene ontology terms in S. cerevisiae and S. pombe. The X-axis shows the enrichment ratio for each gene ontology term in S. cerevisiae and S. pombe. The dashed line indicates an enrichment ratio equals to 1. The statistical significance was indicated by *P < 0.05; calculated by the Fisher’s exact test.

