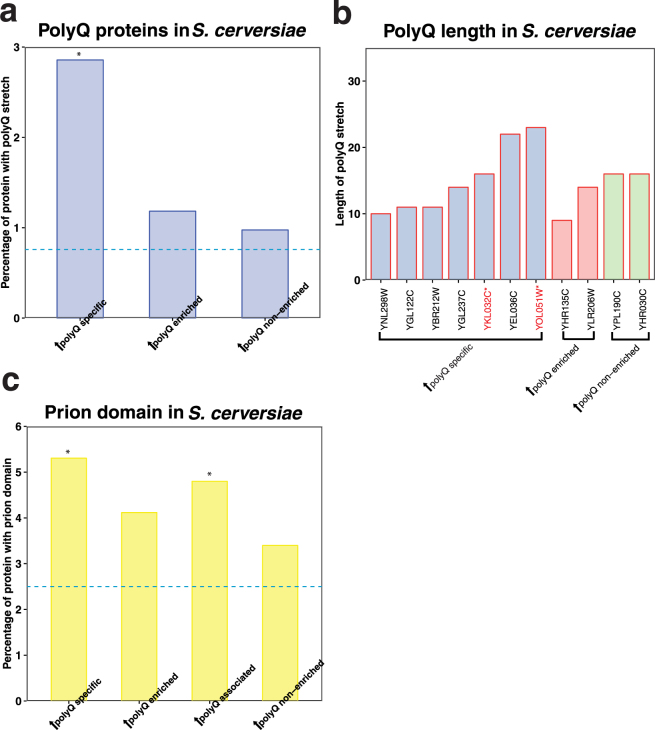
Figure 5.
Prion domain enrichment analysis and polyQ length analysis in expanded Htt co-IP proteins. (a) The bar-plot shows the percentage proteins with polyQ stretch of each group in S. cerevisiae (no proteins with polyQ stretches were found in the S. pombe groups). The Y-axis indicates the percentage of proteins with polyQ stretch, and the X-axis shows the name of each group. The dashed lines show the background percentage of proteins with polyQ stretch in the proteome of S. cerevisiae. Asterisk shows the statistical significance in each group (*P < 0.05), calculated by the Fisher’s exact test. Detailed values and statistical results are provided in Supplementary Table 4. (b) The bar-plot shows the proteins with polyQ stretch of each group in S. cerevisiae. Y-axis indicates the length of polyQ for each protein, and X-axis shows the name of the proteins. Different groups are indicated in different colours [expanded polyQ specific (blue), expanded polyQ enriched (red), and expanded polyQ non-enriched (green) in S. cerevisiae]. Proteins with multiple polyQ stretches are labelled in red. (c) The bar-plot shows the percentage of proteins with prion domains of each group in S. cerevisiae. The Y-axis indicates the percentage of proteins with coiled-coil motifs, and the X-axis shows the name of each group. The dashed lines show the background percentage of proteins with prion domains in the proteome of S. cerevisiae (blue). Statistical significance in each group demonstrated by *P < 0.05 and **P < 0.01, calculated by the Fisher’s exact test. Detailed values and statistical results are provided in Supplementary Table 6.

