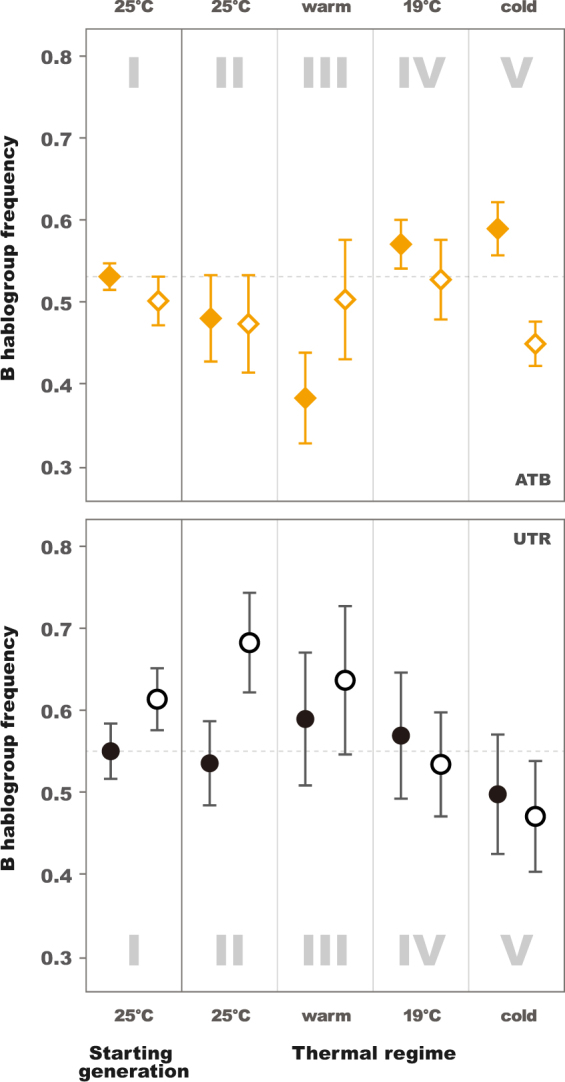
Figure 5.

B mtDNA haplogroup frequency per thermal environment. Plots depict frequencies in starting generation (I) and final generation constant 25 °C (II), fluctuating warm (III), constant 19 °C (IV), and fluctuating cold (V) environments for female (filled shape) and male (empty shape) descendants of flies treated by antibiotics (ATB; yellow squares, 7 replicates) and untreated (UTR; black circles, 8 replicates; in which Wolbachia and associated maternally transmitted microbiomes present). Dashed line marks mean starting B mtDNA haplogroup frequency in females. The error-bars are estimated as where is the sample standard deviation and N the number of samples.
