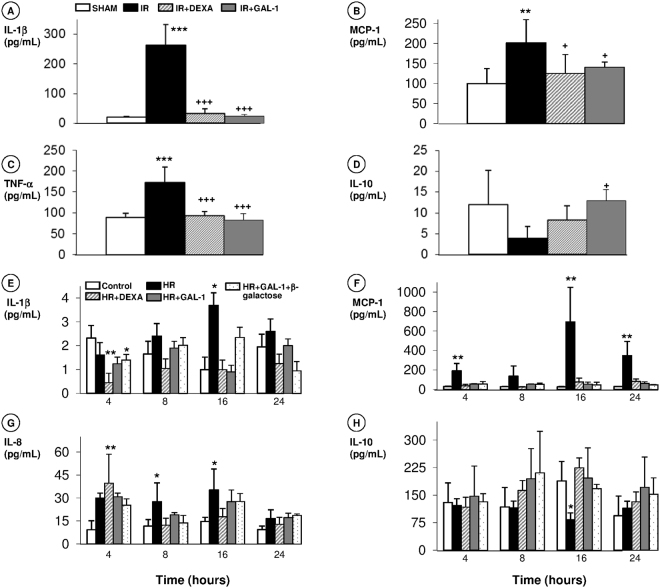
Figure 5.
Effect of GAL-1 treatment on cytokine release in the in vivo and in vitro IR models. (A–C) In vivo, the IR group exhibited elevated urine levels of (A) IL-1β, (B) MCP-1, and (C) TNF-α, while the DEXA and GAL-1-treated groups showed reduced IL-1β. (D) GAL-1 treatment induced elevated IL-10 levels in the urine compared to the levels in the untreated IR group. Data are expressed as the mean ± SD (pg/mL) from the urine (N = 6/group). **p < 0.01 and ***p < 0.01 vs SHAM. +p < 0.05 and +++p < 0.001 vs IR. (E–H) In vitro, supernatant levels of (E) IL-1β, (F) MCP-1, (G) IL-8, and (H) IL-10, under control, HR, HR treated with DEXA or GAL-1 (with or without β-galactose) conditions at 4, 8, 16 or 24 h. HR increased the IL-1β levels at 16 h; the MCP-1 levels at 4, 16 and 24 h; and the IL-8 levels at 8 and 16 h and reduced the IL-10 levels at 16 h. DEXA elevated IL-8 release at 4 h and reduced IL-1β at 4 h compared to the control. These alterations were reversed with GAL-1 or GAL-1 + β-galactose treatments. Data are expressed as the mean ± SD (pg/mL) from the HK-2 cell supernatants (N = 3/group). *p < 0.05 and **p < 0.01, vs control, one-way ANOVA or Kruskal-Wallis test.

