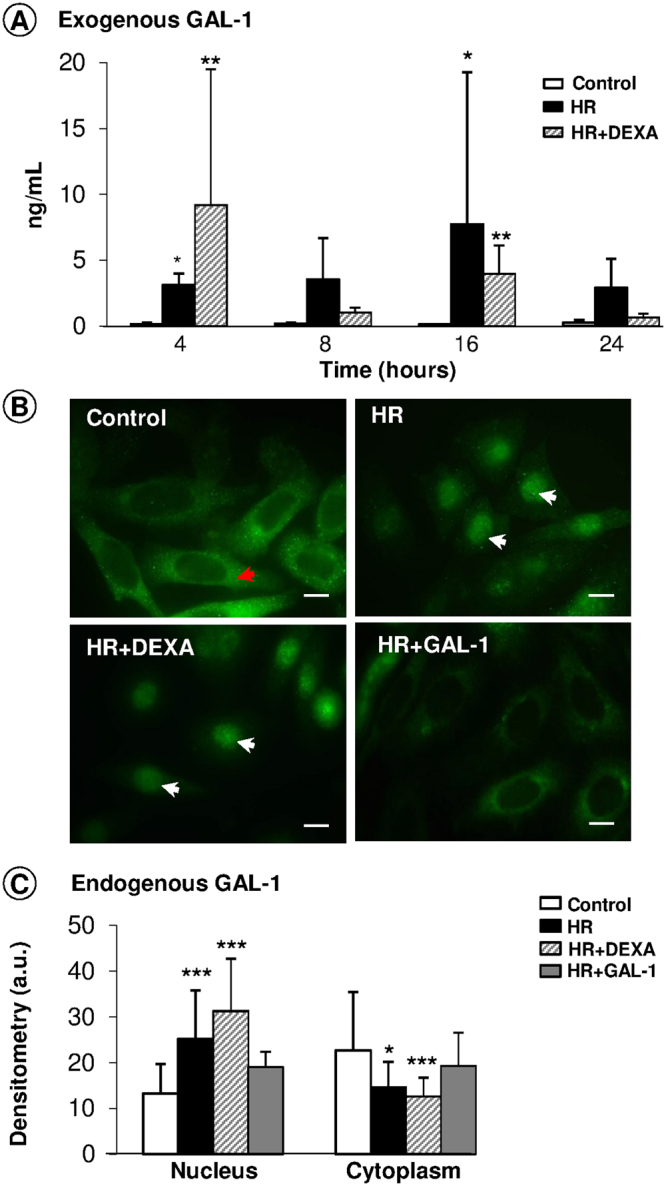
Figure 6.

Expression of endogenous and exogenous GAL-1 in the HK-2 cell assays. (A) HR and DEXA induced GAL-1 release in the supernatants of cells at 4 and 16 h. Data are expressed as the mean ± SE (ng/mL), N = 3/group. *p < 0.05 and **p < 0.01, vs control. (B) GAL-1 expression in the cytoplasm (red arrows) and in the nucleus (white arrows) of the HK-2 cells under different experimental conditions. Bars: 10 μm. (C) Densitometric analysis of GAL-1 expression in the HK-2 cells. Data (arbitrary units, a.u.) represent the mean ± SD of GAL-1 immunoreactivity. *p < 0.05, **p < 0.01 and ***p < 0.001, vs control, Kruskal-Wallis test.
