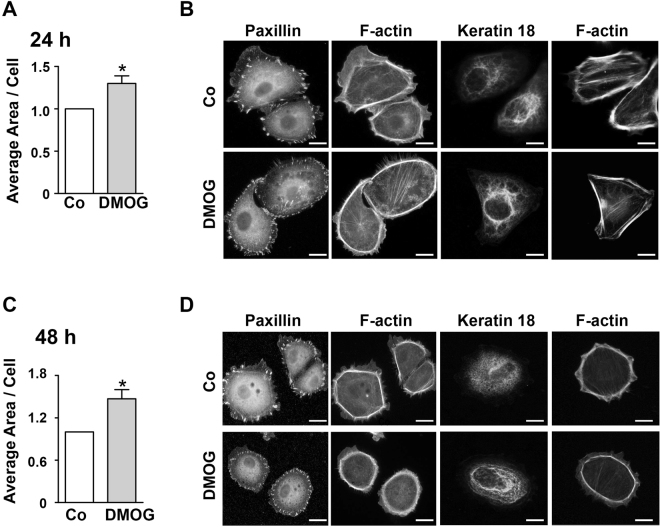
Figure 6.
Spreading of hPTECs. (A) hPTECs were treated with DMOG for 24 h and then seeded at low density (15 000 cells/cm2) on fibronectin-coated glass cover slips. Spreading of hPTECs was assessed 2 h after seeding. Total area covered by phalloidin-stained cells was divided by the number of cells determined by nuclear staining with DAPI. In each experiment, 8–12 randomly chosen fields were evaluated. Data were expressed as means ± SEM of 4 independent experiments. *p < 0.05, one-sided t-test. (B) hPTECs were seeded as in A and treated with DMOG for 48 h. Data were expressed as means ± SEM of 4 independent experiments. *p < 0.05, one-sided t-test. (C) hPTECs were treated as in A. Paxillin and K18 were detected by indirect immunofluorescence and F-actin was visualized by phalloidin. Examples of spread cells were shown. Scale bar: 10 µm. (D) hPTECs were treated as in C. In the spread cells, paxillin and K18 were detected by indirect immunofluorescence and F-actin was visualized by phalloidin. Scale bar: 10 µm.

