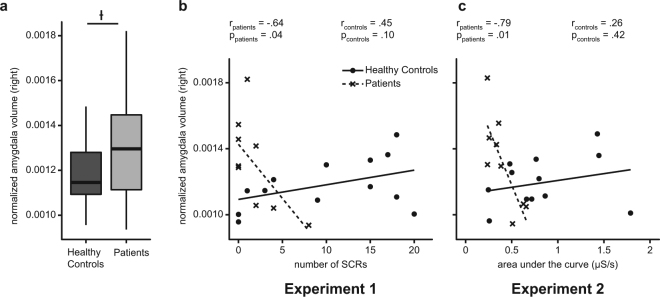
Figure 4.
Results from group comparison of normalized right amygdala volume as visualized by means of boxplots (a) and correlation analyses, showing significant negative associations between measures of skin conductance from experiment 1 (b) resp. experiment 2 (c) and normalized right amygdala volume in patients, but not in controls. Boxplot diagrams show first and third quartile (bottom and top of the box), the median (second quartile indicated by the band inside the box), and the 1.5 interquartile range (IQR) between the first and third quartile (whiskers).

