
Fig. 2.
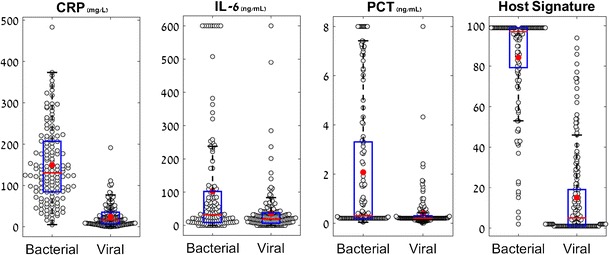
Differential distribution of CRP, IL-6, PCT, and the host-protein signature in bacterial and viral infections. Box plots for CRP, IL-6, PCT, and the host-protein signature measured over the entire study cohort (nB = 139, nV = 175). The y-axis label appears on top of the box plot. Red line corresponds to group median and circle corresponds to group average. The black lines represent the whiskers of the box plot and correspond to 1.5*IQR (interquartile range). nB number of patients with unanimous expert panel diagnosis of bacterial infection, nV number of patients with unanimous expert panel diagnosis of viral infection