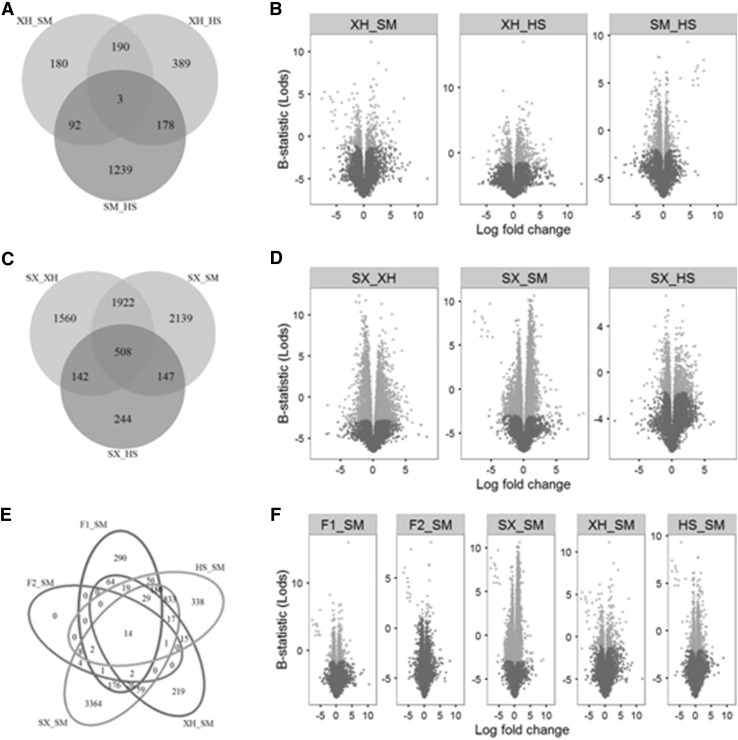
Fig. 6.
Venn and Volcano plots illustrate DE genes by pairwise comparisons of populations. First, the pairwise comparisons are conducted among Xuanhan, Simmental and Holstein (a, b). Second, Shuxuan is compared with Xuanhan, Simmental and Holstein one by one (c, d). Finally, the comparison between Simmental and other five populations are also analyzed (e, f). Venn plots show the numbers of shared and specific DE genes among different comparisons. Volcano plots demonstrate the DE genes with statistical significance (adjusted P value < 0.05, in orange). (Color figure online)

