
Figure 2.
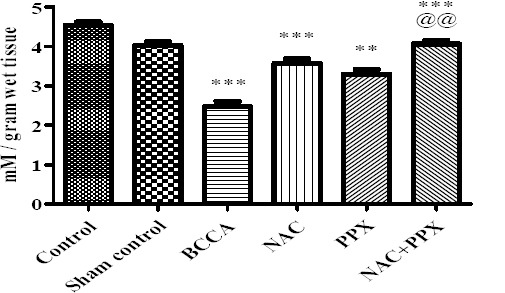
Effect on thiol content of the tissue. Results were expressed as Mean±SEM, *, **, and *** were significantly different at P<0.05, P<0.01, and P<0.001, respectively in comparison with bilateral common carotid artery ligation group. Bilateral common carotid artery ligation group was compared with the sham control; the combination treatment group was compared with individual treatment groups; @@ significantly different at P<0.01 (PPX vs NAC+PPX)