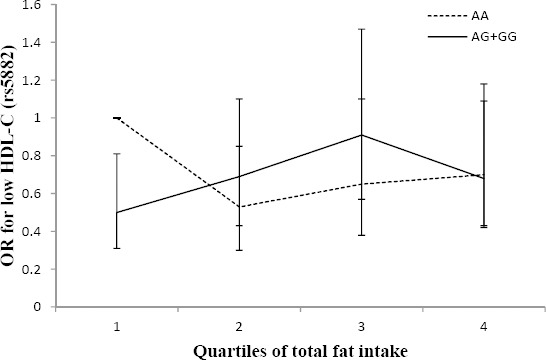
Figure 3.

Adjusted OR for low HDL-C across quartiles of total fat intake by the rs5882 genotypes (Pinteraction=0.05; Q1<26, Q2:26.1–29.4, Q3:29.5–33, Q4>33.1% of energy). The G allele carriers had a lower odds ratio of low HDL-C in the first quartile of total fat intake (Ptrend for AA and AG+GG genotypes are 0.3 and 0.04, respectively)
