
Figure 8.
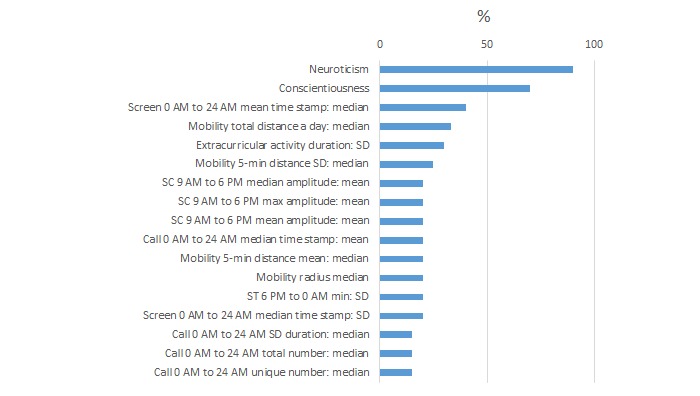
Percentage of time each feature was selected across 10-cross-validation for high or low Perceived Stress Scale (PSS) classification models with 1 month of data.
Official websites use .gov
A
.gov website belongs to an official
government organization in the United States.
Secure .gov websites use HTTPS
A lock (
) or https:// means you've safely
connected to the .gov website. Share sensitive
information only on official, secure websites.
Percentage of time each feature was selected across 10-cross-validation for high or low Perceived Stress Scale (PSS) classification models with 1 month of data.